
A warehouse photometric plan shows how much light will reach the floor, aisles, storage areas and work zones before the lighting is installed. Instead of choosing high-bay fixtures by wattage or lumen output alone, the plan uses the actual IES photometric data for each luminaire to calculate point-by-point light levels across the space.
For warehouses, that matters because ceiling height, fixture optics, rack layout and the type of work being performed can change the lighting result dramatically. A layout that produces enough average light can still have dark areas, poor uniformity or excessive light directly below fixtures.
This guide explains what a warehouse photometric plan includes, typical planning light levels, how high-bay fixtures are spaced, and what the calculation results actually mean. It also includes a real Stetra Lighting warehouse example.
What Is a Warehouse Photometric Plan?
A warehouse photometric plan is a computer-calculated lighting study of an industrial or storage space. The warehouse geometry is modeled, the selected luminaires are placed at their intended mounting heights, and the lighting software calculates illuminance across defined calculation surfaces.
- fixture locations and quantities
- high-bay mounting heights
- point-by-point foot-candle or lux values
- average, minimum and maximum illuminance
- uniformity ratios
- false-color lighting distribution
- fixture model, wattage, lumen output and CCT
- lighting power density where needed
- calculation assumptions such as light-loss factor
If you are new to photometric calculations, start with our complete guide to photometric plans.
Why Warehouses Need Photometric Calculations
Warehouse lighting is highly dependent on geometry. Two fixtures with similar wattage and lumen output can create very different results if their optics, mounting heights or spacing are different.
A photometric calculation helps answer practical questions before installation: Are the aisles bright enough? Is the floor uniformly illuminated? Are there dark areas between fixture rows? Is the layout over-lighted? Could fewer fixtures meet the same target? Will a different distribution work better at the proposed ceiling height?
This makes the photometric plan useful for new construction, LED retrofits, fixture substitutions, design coordination and projects where the owner, engineer or reviewing authority wants documented lighting performance.
Warehouse Lighting Levels: How Many Foot-Candles Are Needed?
There is no single correct foot-candle level for every warehouse. The appropriate target depends on the visual task, occupancy, storage method, equipment, traffic and project requirements.
| Warehouse Area | Common Planning Range | Design Consideration |
|---|---|---|
| Inactive / low-activity storage | 5-10 fc | Basic visibility with limited activity |
| General storage / active warehouse | 10-30 fc | Typical storage, circulation and material handling |
| Picking / packing areas | 30-50 fc | Reading labels, sorting and repeated visual tasks |
| Detailed inspection / fine work | 50 fc and higher | Higher visual demand; task-specific criteria should be confirmed |
These are practical planning ranges, not universal code requirements. Final light levels should be selected for the actual task and verified against the project specifications, applicable standards and local requirements.
The important point is that a warehouse should not automatically be designed to one light level everywhere. A bulk-storage area may have a different target than a packing station, loading area or inspection zone.
Real Warehouse Photometric Plan Example
The following example is from a real Stetra Lighting warehouse calculation. The modeled floor area is approximately 381 ft by 195 ft. The design uses a regular high-bay grid to provide consistent coverage throughout the open warehouse.
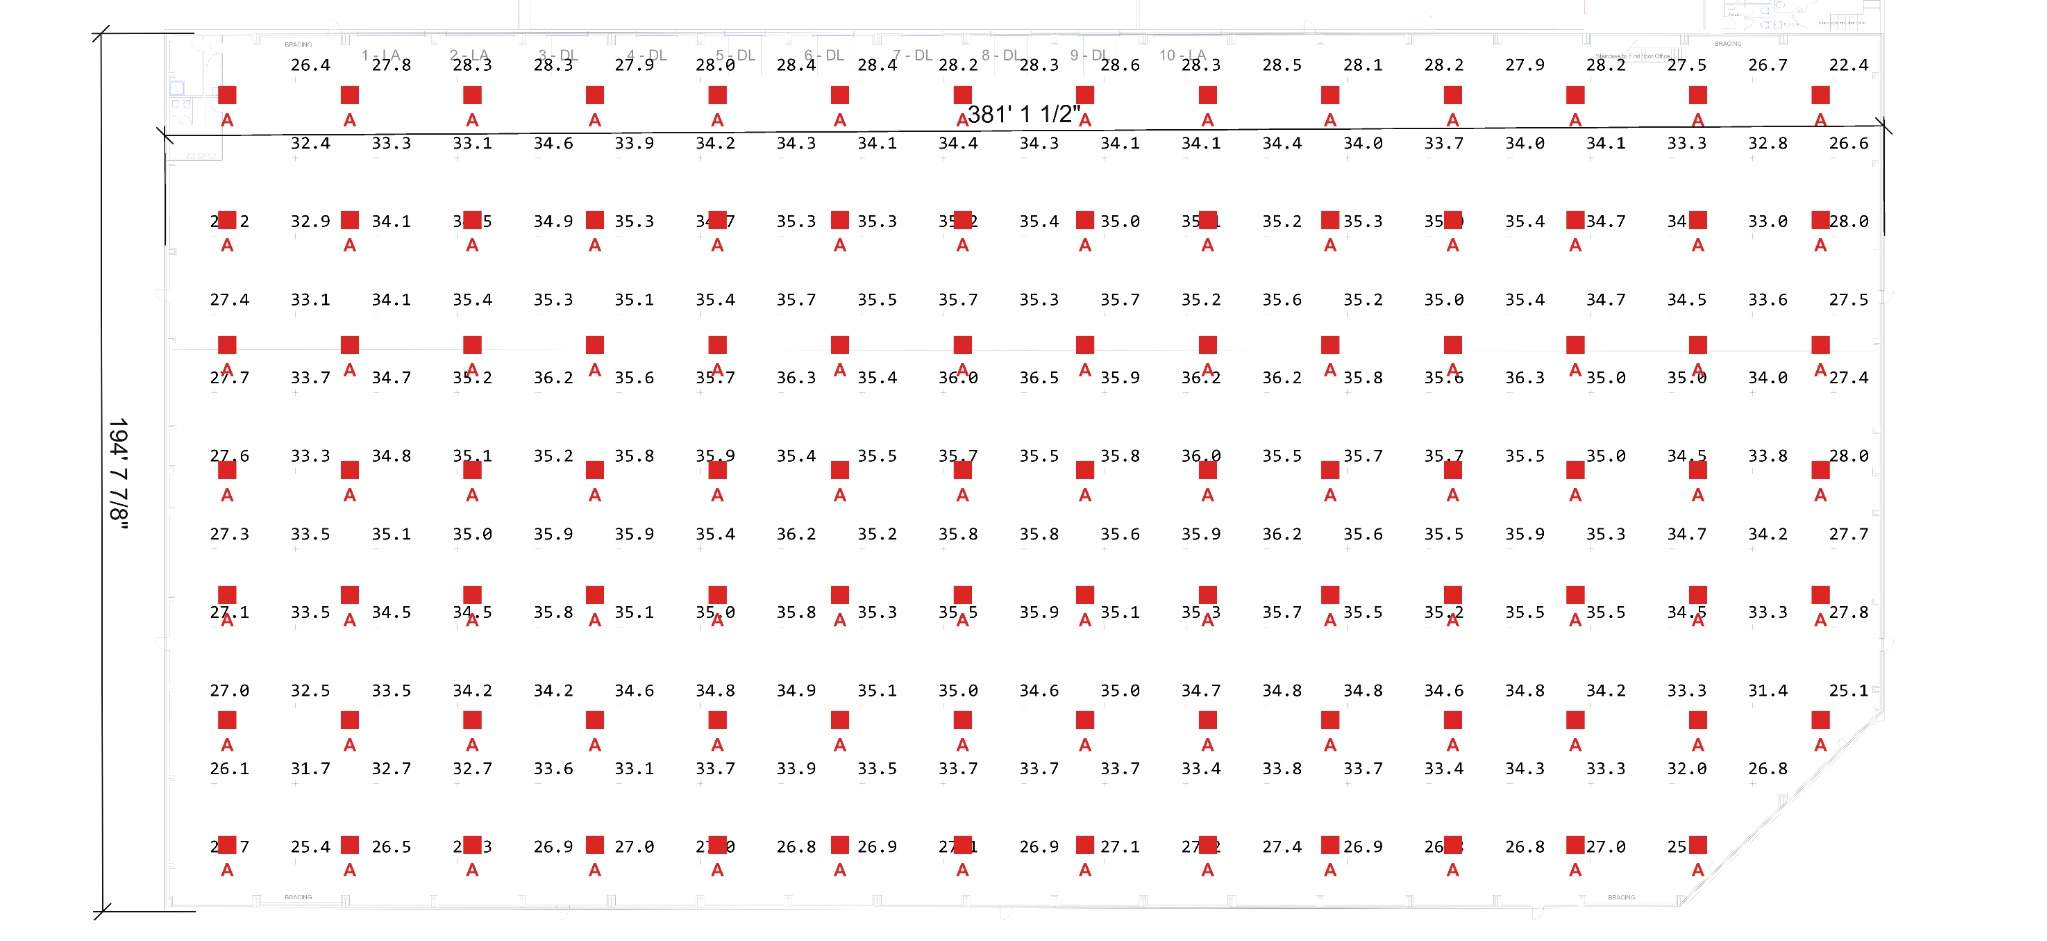
The point-by-point values make it possible to evaluate more than the average. They show where illumination rises or falls throughout the floor and whether the fixture spacing creates consistent coverage.
Warehouse Photometric Results: Average, Minimum and Uniformity
For this example, the calculated warehouse results are:
| Metric | Calculated Result |
|---|---|
| Average illuminance | 32.7 fc |
| Maximum illuminance | 36.7 fc |
| Minimum illuminance | 15.1 fc |
| Average : minimum | 2.17 : 1 |
| Maximum : minimum | 2.43 : 1 |
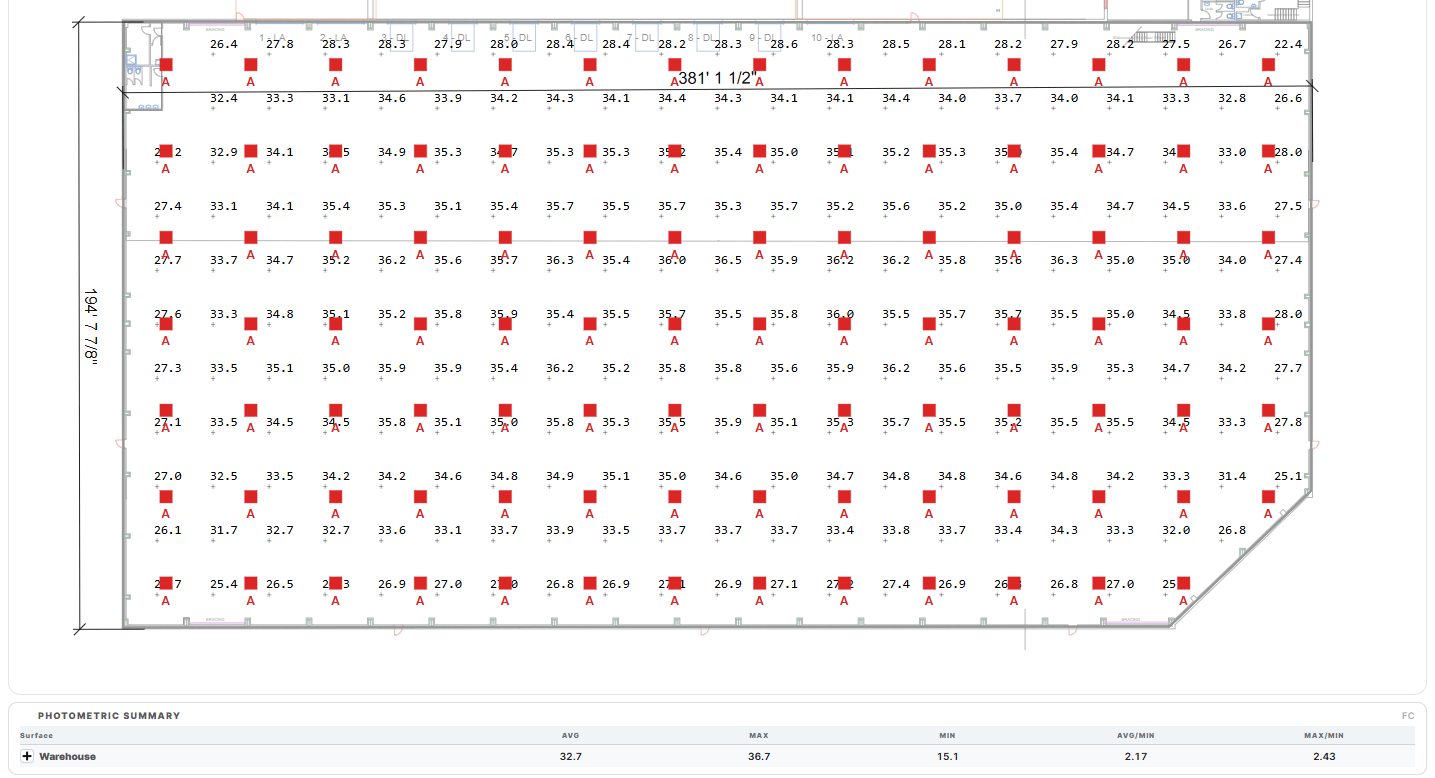
Average illuminance alone does not tell the full story. A warehouse could have a strong average while still containing dark areas. That is why minimum values and uniformity ratios are checked together with the point-by-point grid.
For more on this metric, see our guide to lighting uniformity ratio.
High-Bay Fixture Selection in the Example
- Quantity: 97 fixtures
- Input power: 149.7 W per fixture
- Lumen output: 27,000 lm per fixture
- Mounting height: 36 ft
- Color temperature: 5000 K
- Light-loss factor: 0.90
- Total connected load: 14,521 W
- Total lumens: 2,619,000 lm
- Calculated lighting power density: 0.20 W/ft²
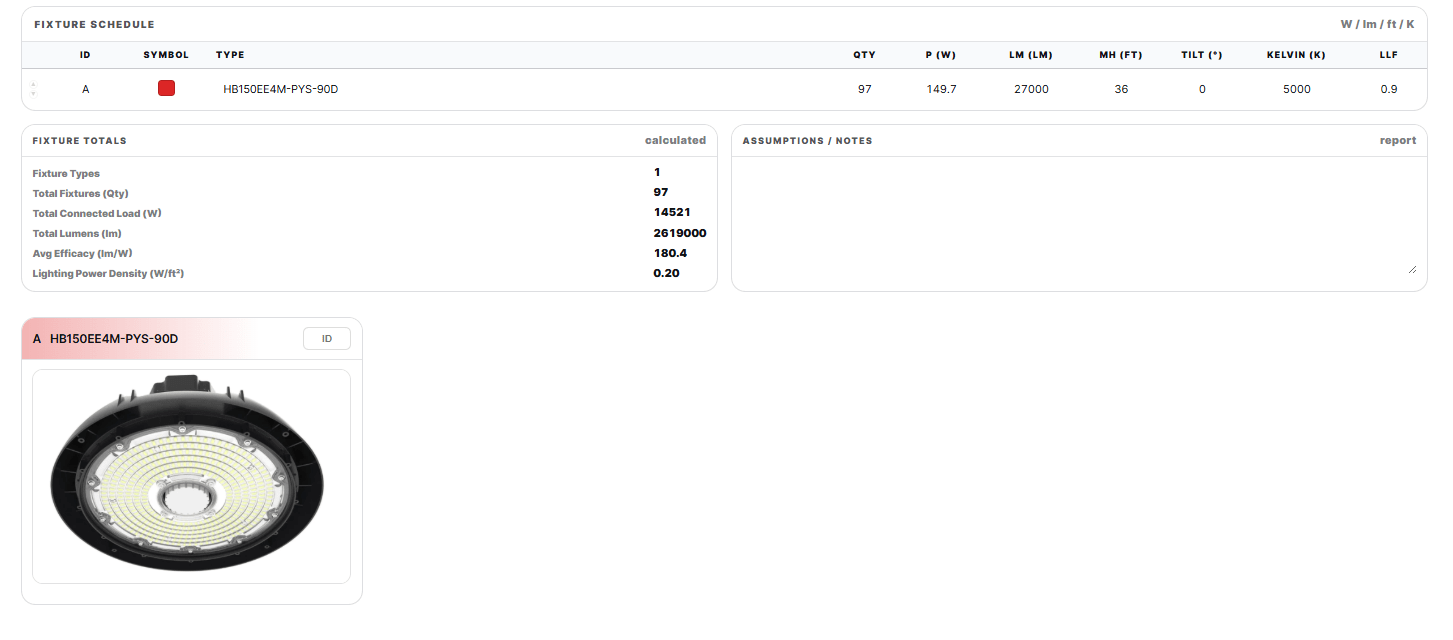
The important design input is not simply “150-watt high bay.” The photometric calculation uses the fixture’s actual light distribution. Two nominally similar high bays can require different spacing because their optics and candela distribution are different.
Why Mounting Height Changes the Warehouse Layout
Mounting height directly affects the size and intensity of the light pattern on the working plane. A higher luminaire can spread light over a larger area, but the illuminance at the floor changes as the distance increases. A lower mounting height may produce stronger light directly below the fixture while requiring tighter spacing for uniform coverage.
That is why fixture quantity should not be determined from lumens per square foot alone. The IES file, optic, mounting height and room geometry need to be calculated together.
How High-Bay Fixtures Are Spaced
High-bay spacing is usually developed as a grid and then tested photometrically. The designer evaluates the spacing relative to mounting height, fixture distribution and target light level, then adjusts the rows until the required coverage and uniformity are achieved.
In an open warehouse like this example, a regular grid can work very well because there are few obstructions. A racked warehouse is different: fixture rows often need to coordinate with the rack aisles so that light reaches the floor and vertical storage faces rather than landing primarily on top of the racks.
False-Color Analysis: Seeing the Distribution
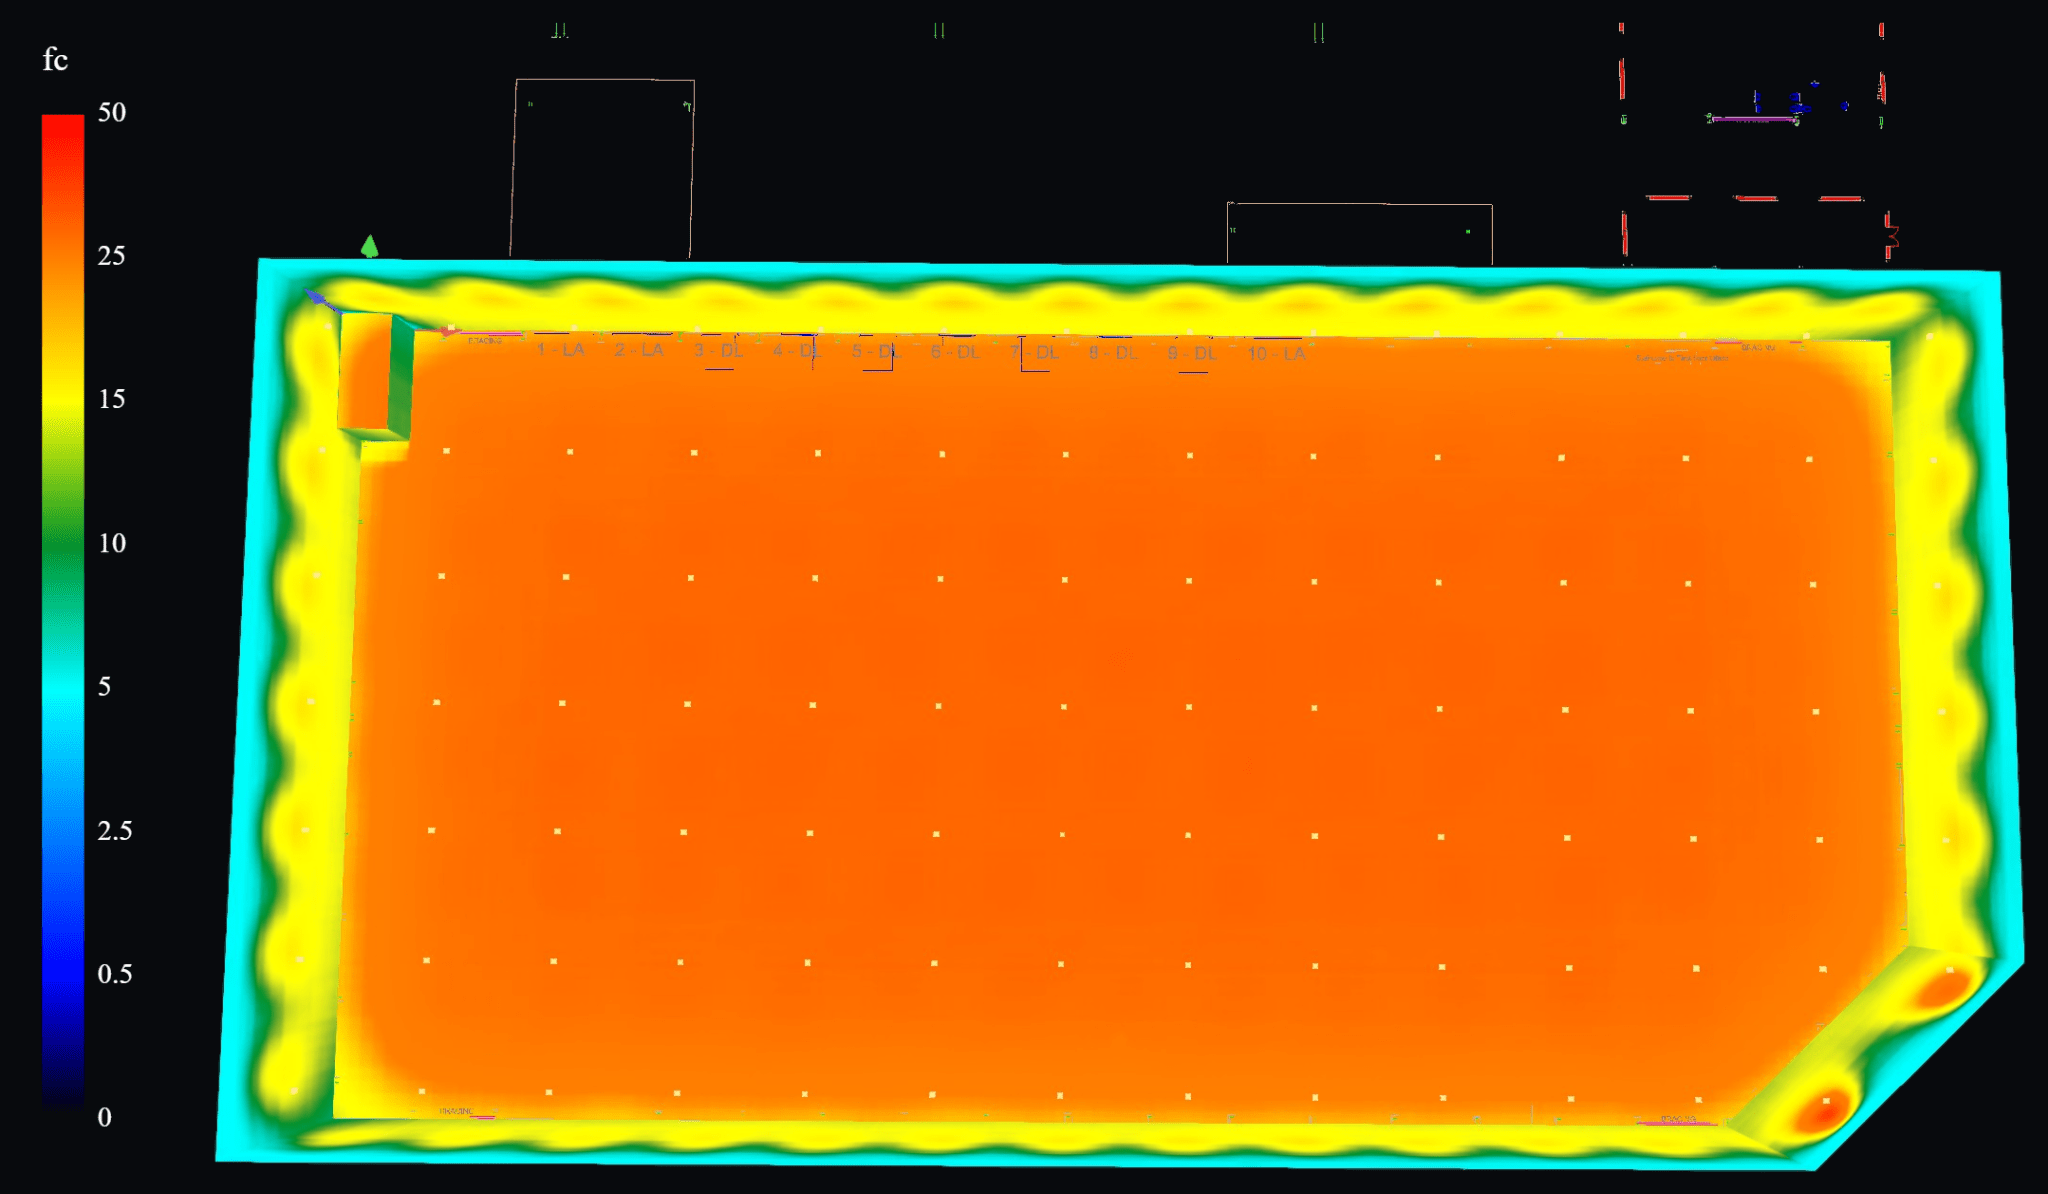
A false-color view turns the calculation into a visual map. It is useful for spotting perimeter falloff, hot spots under fixtures and areas where the light distribution changes.
3D Warehouse Lighting Render
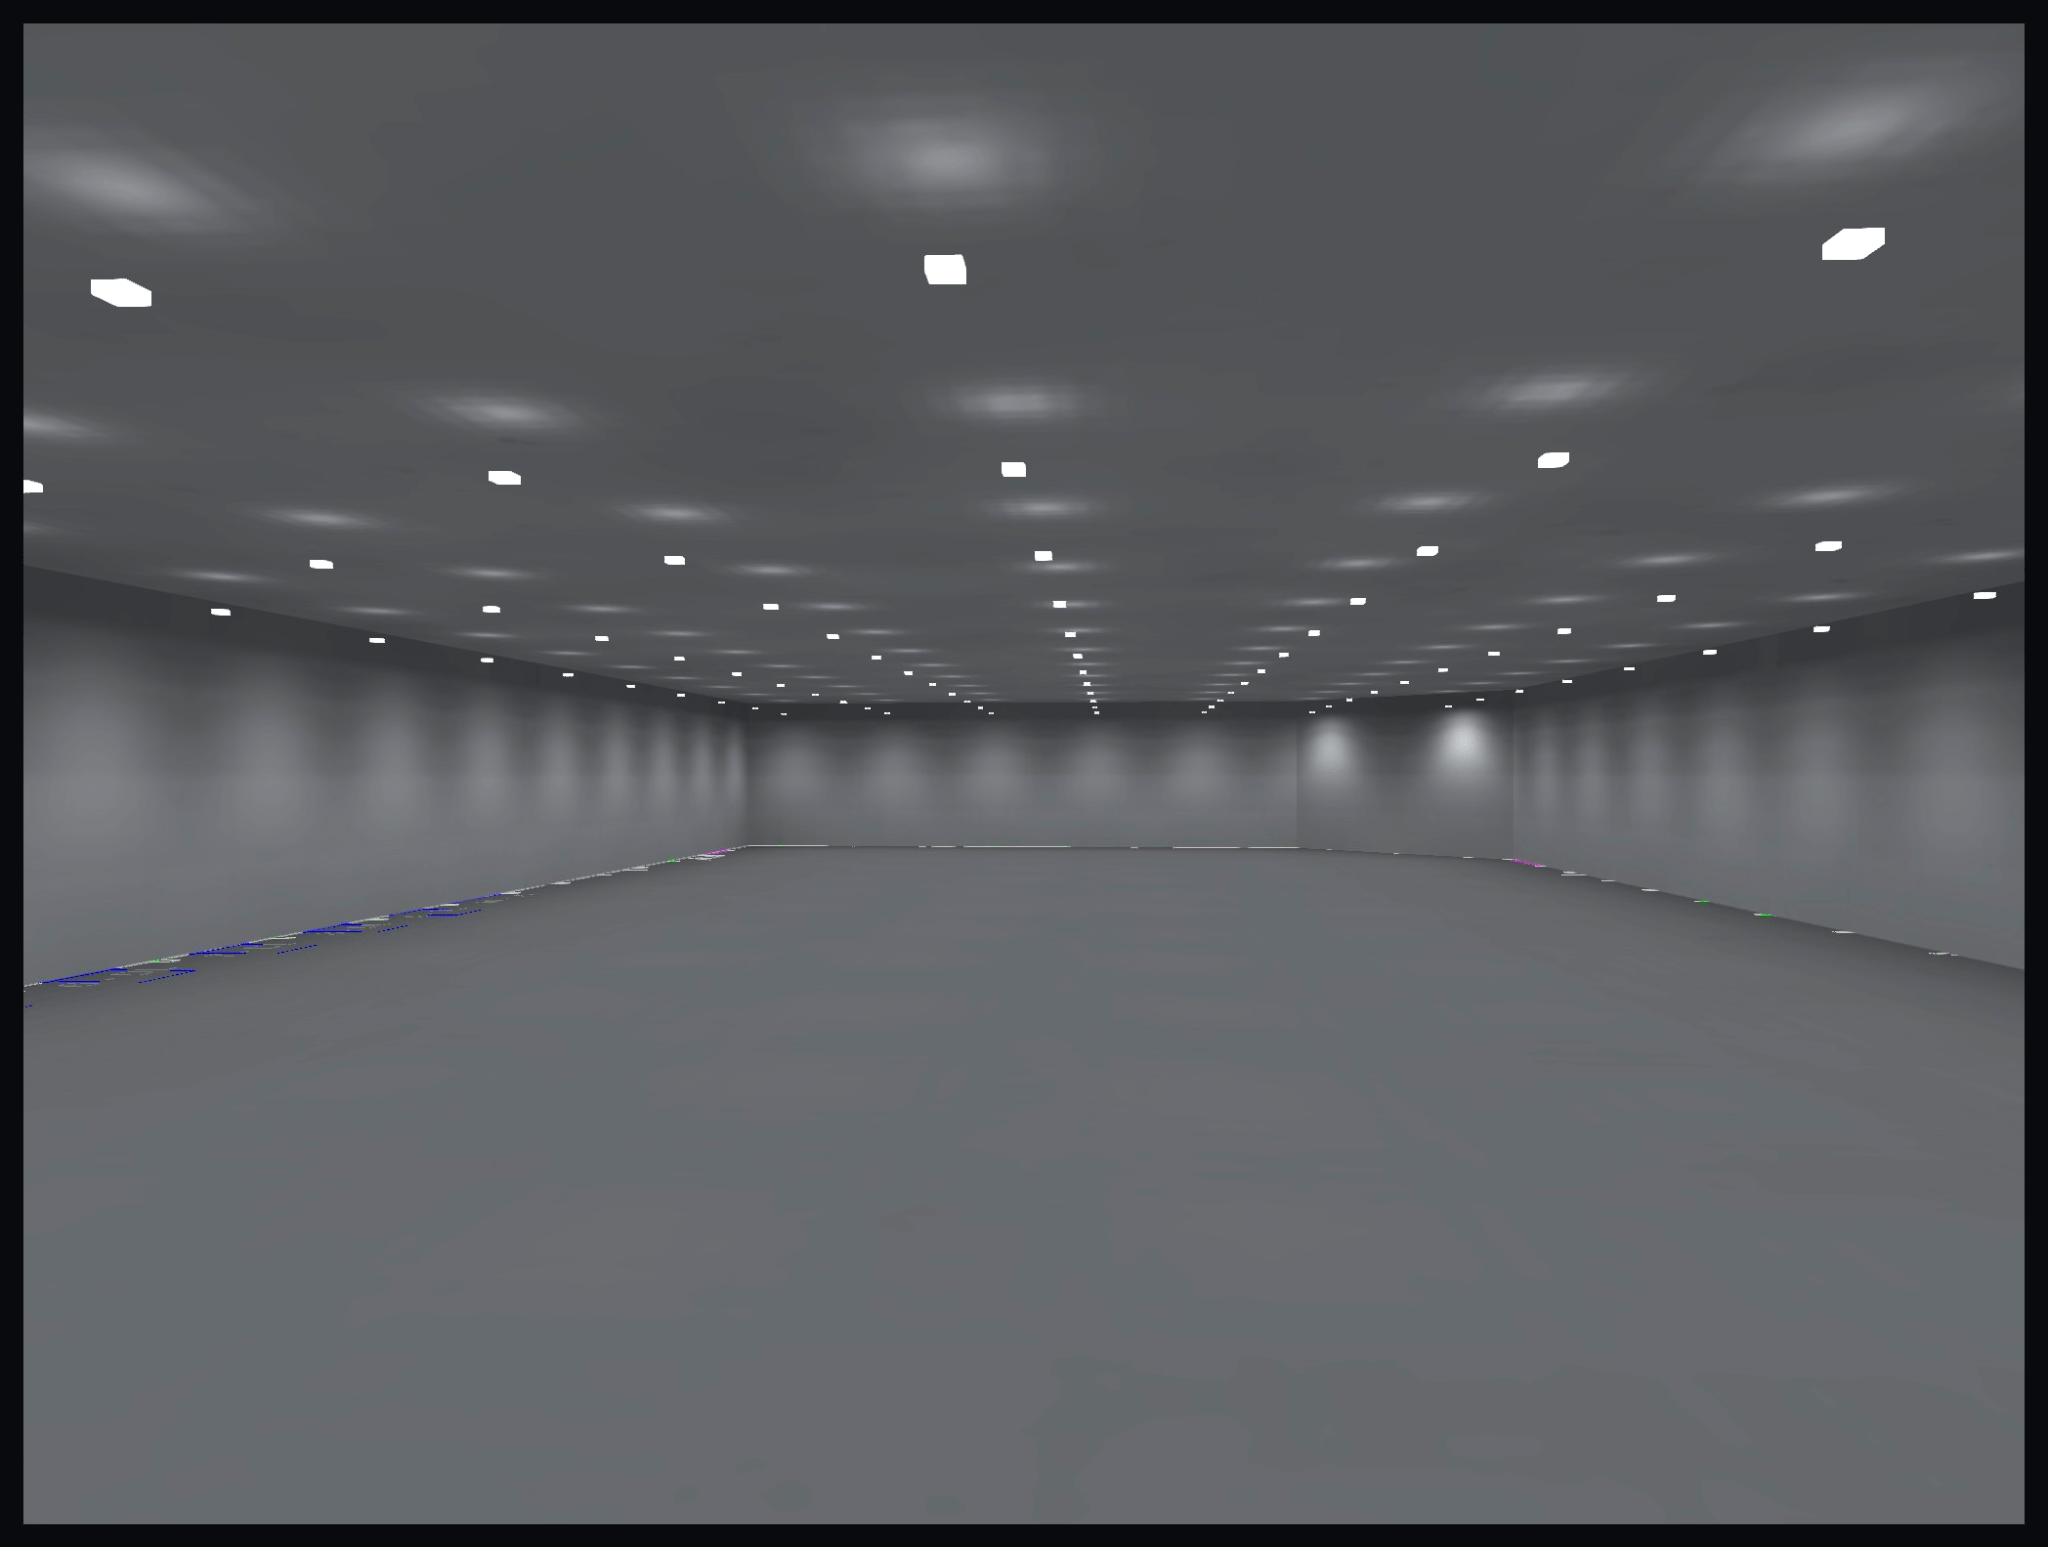
The 3D render helps communicate what the calculated layout will look like in the space. It is especially useful when reviewing fixture rows, mounting locations and the overall visual effect with an owner, architect or contractor.
Open Warehouse vs. Racked Warehouse Photometrics
An open warehouse floor is generally easier to calculate because the luminaires have a clear path to the floor. Racking introduces vertical surfaces and obstructions that can change the design substantially.
For a racked warehouse, the photometric model should consider the actual aisle geometry whenever it is available. A strong floor average in an empty model does not automatically mean the final racked aisles will have the same lighting quality.
Depending on the task, the designer may need to review horizontal illuminance at the floor, vertical illuminance on rack faces, aisle uniformity and the effect of narrow or wide optics.
Warehouse Lighting: Lumens vs. Foot-Candles
Lumens describe how much light a luminaire produces. Foot-candles describe how much light reaches a surface. A 27,000-lumen fixture mounted at 36 ft does not guarantee a particular floor light level. The result depends on the fixture’s photometric distribution, spacing, room geometry, reflectances and light-loss assumptions.
What Information Is Needed for a Warehouse Photometric Plan?
- A dimensioned floor plan, reflected ceiling plan or CAD file.
- Warehouse ceiling height and intended fixture mounting height.
- Rack layout and rack height, if applicable.
- Areas used for storage, picking, packing, loading or detailed work.
- Proposed fixture model numbers and IES files, if already selected.
- Required light levels or project specifications.
- Any owner, engineer, utility or jurisdiction requirements.
- Information about existing fixtures when the project is an LED retrofit.
What Should the Final Warehouse Photometric Report Include?
A professional warehouse report should make it easy to understand both the design inputs and the calculated results. Depending on the scope, that can include the fixture layout, point-by-point results, calculation summary, fixture schedule, mounting heights, false-color visualization, 3D render and relevant notes or assumptions.
Common Warehouse Lighting Design Mistakes
- Choosing fixtures by wattage alone. Wattage is power consumption, not delivered illumination.
- Using only a lumen-per-square-foot calculation. It cannot show the actual distribution or uniformity.
- Checking only the average foot-candle value. Minimums and dark areas can be missed.
- Ignoring mounting height. The same fixture behaves differently at different heights.
- Ignoring future racking. A photometric plan for an empty warehouse may not represent a completed racked facility.
- Using the wrong IES file. Different optics of the same fixture family can produce very different layouts.
- Over-lighting the entire warehouse. Different task areas may need different lighting targets.
Do Warehouse Photometric Plans Help Reduce Fixture Quantity?
They can. A calculated layout can reveal when fixtures are unnecessarily close together or when a different optic can provide the required coverage with fewer luminaires. The objective is not simply to minimize quantity; the final layout still needs to satisfy the selected light-level, uniformity, task and project requirements.
When Should the Photometric Plan Be Done?
The best time is before fixtures are purchased or installed. This gives the project team time to adjust fixture quantity, spacing, optics, wattage or mounting height without creating field rework.
See when a photometric plan is typically needed.
Frequently Asked Questions
What is a warehouse photometric plan?
It is a computer-calculated lighting layout that uses real fixture photometric data to predict foot-candle or lux levels throughout a warehouse before the lighting is installed.
How many foot-candles should a warehouse have?
There is no single number for every warehouse. Low-activity storage may use relatively low light levels, while active storage, picking, packing and inspection areas generally require more. The target should be chosen for the actual task and project requirements.
How many high-bay lights does a warehouse need?
The quantity depends on warehouse dimensions, ceiling and mounting height, fixture lumen output, optic, IES distribution, rack configuration and required light level. A photometric calculation is the reliable way to determine the layout.
Should warehouse racking be included in the photometric model?
Yes, when the rack layout is known and it materially affects the lighting. Racks can block and reshape light distribution within aisles, so an empty-room calculation may not represent the final condition.
Can a warehouse photometric plan be used for an LED retrofit?
Yes. A photometric model can compare proposed LED high bays with the existing layout and verify whether the new design provides the required light levels before fixtures are purchased.
Request a Warehouse Photometric Plan
Stetra Lighting prepares professional warehouse photometric plans using project geometry, actual IES files and point-by-point lighting calculations.
Send the warehouse floor plan, ceiling or mounting height, rack layout if available, and the proposed fixture information. We can then review the scope and determine what calculations are needed.
Use the Request a Photometric Plan button in the article navigation to send your warehouse project for review.