How to Read a Photometric Plan
A photometric plan is read by checking six things in order: the calculation area, the fixture schedule, the point-by-point foot-candle or lux values, the iso-footcandle contours, the uniformity ratios, and the edge-of-site spill light. If those items are clear and they match the project requirements, the lighting layout is usually on the right track.
Most people do not struggle because the drawing is complicated. They struggle because the plan mixes layout, performance, and code-related information on one sheet. Once you know what each part is doing, the review becomes much faster.
This guide is for lighting designers, contractors, engineers, architects, permit applicants, developers, and property owners who need to review a photometric plan with confidence. It explains what to look at first, how to read the numbers, what red flags matter, and when a plan is not ready for permit review.
If you need background first, start with our guide to what a photometric plan is. If your project is exterior, our article on parking lot photometric plans goes deeper on site lighting, uniformity, and property-line control.
What a photometric plan actually shows
A photometric plan is a lighting layout backed by calculated light levels. It uses fixture photometric data, usually from manufacturer IES files, to predict how light will fall across the site, room, or work plane. In the United States, the plan is usually shown in foot-candles. Some projects also show lux.
- Fixture locations: Where each luminaire, pole, wall pack, canopy fixture, or interior fixture is placed.
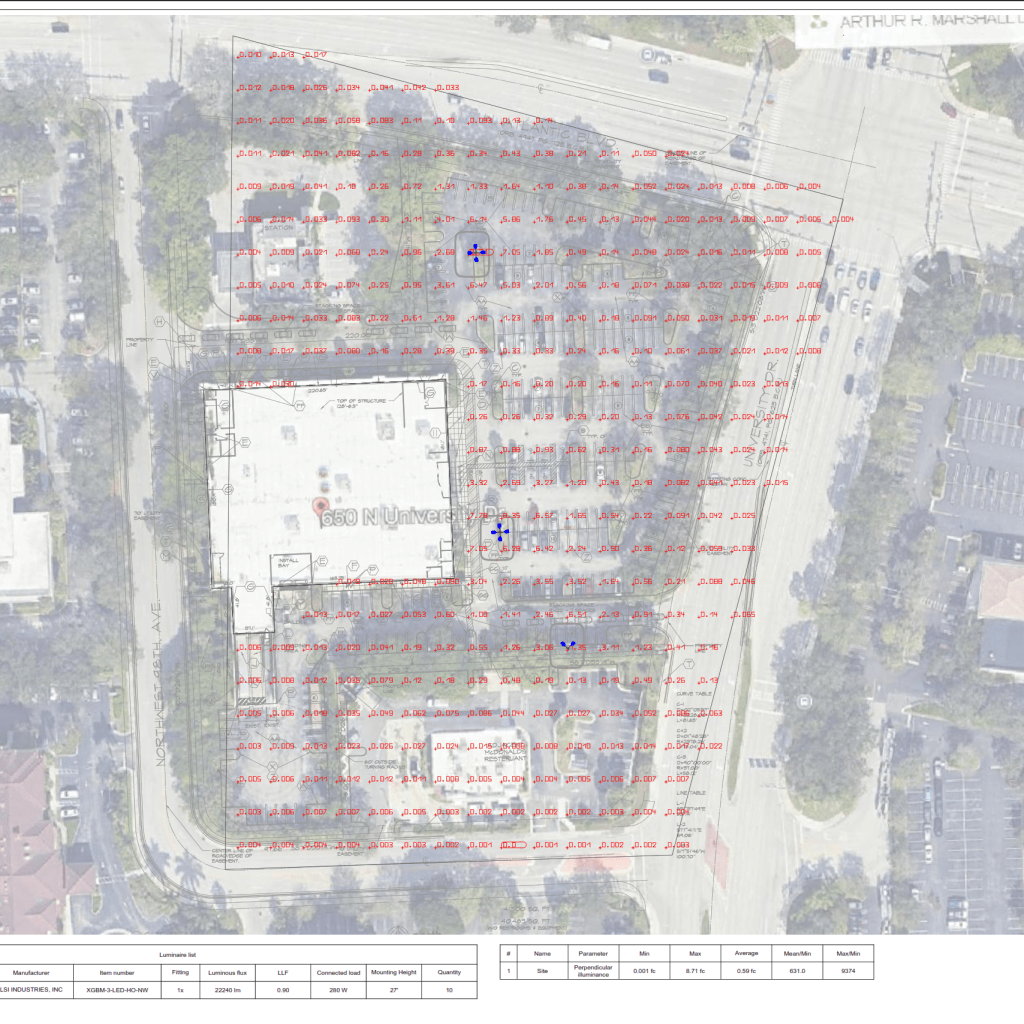
- Fixture tags and schedule: The model, output, optics, beam angle, mounting height, and other assumptions tied to each symbol.
- Calculation grid: The points where software calculates light levels.
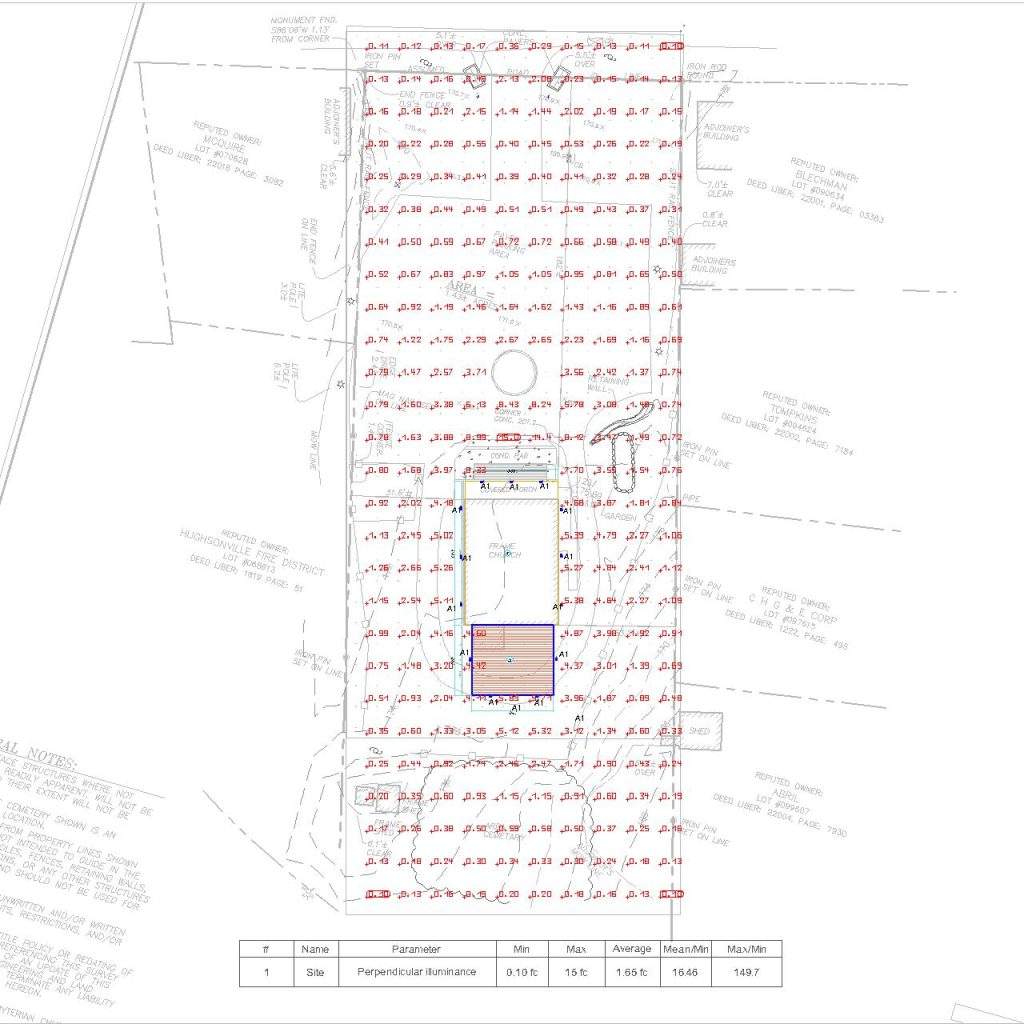
- Point-by-point values: The actual foot-candle or lux readings at each calculation point.
- Iso-footcandle contours: The contour lines that show how light spreads between points.
- Summary metrics: Minimum, maximum, average, and uniformity values.
- Compliance notes: Information related to code compliance, spill light, glare control, and permit-ready submittals.
The main question is simple: does the lighting design produce the right light levels in the right places without creating glare, dark spots, or spill light where it does not belong?
What to check before you study the numbers
Do not jump straight to the average foot-candles. That is one of the most common review mistakes. Start with the assumptions. A plan can look fine on paper and still be wrong if the calculation area, mounting height, optics, or fixture file is wrong.
- Units: Confirm whether the plan uses foot-candles or lux. For U.S. projects, foot-candles are usually the primary unit. One foot-candle is about 10.76 lux.
- Calculation plane: For site lighting, the plane is often grade. For interiors, it may be the floor or a work plane such as 30 inches above finished floor.
- Fixture schedule: Confirm that the fixture tags on the drawing match the listed models, outputs, and optics.
- Mounting assumptions: Pole height, arm length, setback, tilt, and aiming all change the results.
- Site geometry: Make sure the modeled area matches the actual project limits, drive lanes, parking bays, sidewalks, entrances, and property lines.
- IES files: The plan should be based on the intended fixture photometry, not a placeholder distribution that makes the numbers look better than reality.
If those assumptions are wrong, the rest of the photometric plan is not reliable.
How to read a photometric plan step by step
1. Confirm the calculation area and project scope
Start by identifying exactly what area is being measured. Is the plan reviewing the whole site or only the parking field? Are sidewalks, drive aisles, stairs, canopies, entrances, and loading areas included? A plan that excludes critical areas can hide low-light zones and create a false sense of compliance.
For permit review, confirm that the plan covers the areas the authority having jurisdiction actually cares about. That often includes drive lanes, pedestrian paths, accessible routes, and property lines where spill light must be controlled.
2. Match the fixture tags to the schedule and IES files
Every fixture symbol on the drawing should tie back to a fixture schedule. Review the luminaire type, lumen package, CCT, optics, beam distribution, shielding, and mounting details. A Type III optic, a Type V optic, and a narrow beam flood can all produce very different results even at the same wattage.
This is where many weak lighting layouts fall apart. The plan might show acceptable foot-candles, but the actual fixture selection is too wide, too narrow, or too bright for the spacing used. If the schedule does not clearly identify the fixture and optic, the plan is not ready for serious review.
If you want a deeper breakdown of how the calculations are created, see our guide to photometric analysis.
3. Read the point-by-point foot-candle or lux values
The point-by-point values are the core of the plan. Each number shows the calculated light level at that exact point. Higher numbers mean brighter areas. Lower numbers show where visibility may drop off.
Look at the task areas first. On a site plan, that may mean drive aisles, parking stalls, sidewalks, loading zones, or entries. On an interior plan, it may mean the work plane, circulation paths, shelving, or equipment areas. Ask two questions:
- Do the important areas reach the required or targeted light level?
- Are there sharp drops between fixtures that create dark spots?
Do not judge the layout by the brightest points near the luminaires. The minimum values and the transitions between fixtures often matter more for visibility, safety, and uniformity.
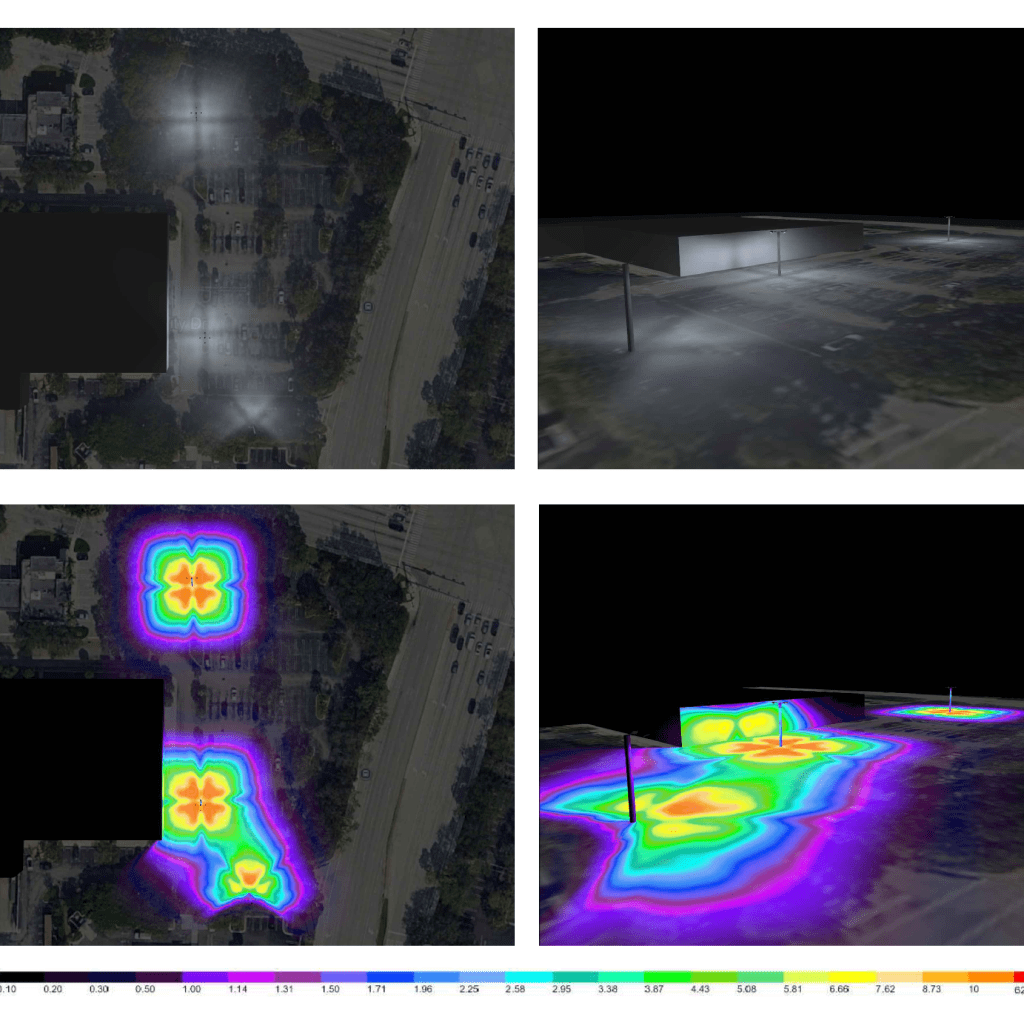
4. Use the iso-footcandle contours as a visual check
Iso-footcandle contours make the plan easier to scan. They show how light spreads across the space. Tight rings around a pole usually indicate hot spots. Long weak stretches between poles often indicate poor fixture spacing or the wrong optics.
Contours are helpful, but they are not enough by themselves. Always verify them against the point-by-point values. A contour graphic can look smooth while the grid still reveals weak minimums or excessive contrast.
5. Review minimum, maximum, average, and uniformity
This is where the lighting layout becomes a performance review. The averages tell you overall brightness. The minimum tells you how dark the worst area is. The maximum helps identify hot spots. The uniformity ratio shows how evenly the light is distributed.
One of the easiest mistakes is approving a plan because the average foot-candles look strong. A high average does not guarantee a good design. You can still have dark pockets, glare, and poor visibility if the minimum is too low or the ratios are too high.
- Average: Useful for understanding general brightness, but never enough on its own.
- Minimum: Critical for safety, visibility, and perceived quality.
- Maximum: Helps identify overlit areas and potential glare.
- Uniformity: Lower ratios usually indicate a more even and usable design.
Your acceptable ratio depends on the application, owner criteria, and local requirements. The point is not to chase a single magic number. The point is to confirm that the light is balanced and appropriate for the use of the space.
6. Check spill light, glare control, and edge conditions
A plan is not complete just because the center of the site is bright enough. Check the property lines, adjacent lots, residential edges, and public right-of-way. Excessive spill light can trigger permit comments, neighbor complaints, and redesign work.
This is also where optics matter. The wrong distribution can make the average light levels look fine while throwing unnecessary light beyond the site. Review shielding, beam angle, cutoff, BUG-related considerations when applicable, and any notes tied to dark-sky or municipal requirements.
7. Decide whether the plan is permit-ready
A permit-ready photometric plan should do more than show numbers. It should clearly communicate how the lighting design was built and what assumptions were used. In practice, that means readable fixture tags, a clean lighting layout, a clear schedule, usable tables, and notes that align with the actual fixture submittal.
- Fixture quantities on the plan should match the schedule.
- Mounting heights and optics should be clearly identified.
- Calculation points should cover the real use areas.
- Spill light and glare control should be addressed where relevant.
- The layout should be realistic to build, not just mathematically attractive.
If the drawing is missing those basics, it may still be a design draft, but it is not a strong permit document.
How to tell if a photometric plan is strong or weak
A strong plan is not the brightest plan. It is the plan that meets the project target with controlled, even, buildable light.
- Strong plan: Clear fixture schedule, realistic fixture spacing, balanced foot-candles, acceptable uniformity, controlled spill light, and notes that support code compliance.
- Weak plan: High averages with low minimums, obvious hot spots, generic or missing IES references, poor edge control, or vague notes that do not match the fixture submittal.
If the lighting layout solves brightness by simply adding more output, that is usually not a strong design decision. In many cases, the better fix is revised fixture spacing, lower glare optics, better aiming, or a different mounting strategy.
Example: reading a parking lot photometric plan
Here is a practical way to review a parking lot photometric plan. Assume the drawing shows a commercial parking field with drive aisles, parking bays, and pedestrian paths at the building entry.
- First check: Are the drive aisles and pedestrian areas included in the calculation area, or only the parking stalls?
- Second check: Do the pole heights, arm lengths, and optics on the drawing match the schedule?
- Third check: Are there low points between poles that could create poor visibility or security complaints?
- Fourth check: Are the highest values concentrated directly under the poles, creating harsh contrast?
- Fifth check: Do the property-line values suggest spill light or permit risk?
For example, a plan may show a respectable average light level but still be weak because the minimum values collapse between poles and the edge-of-site values are too high. That is not a fixture count problem alone. It is usually a spacing, optics, or glare-control problem. The right correction may be to change the distribution pattern, move poles, reduce output in the wrong locations, or add shielding.
If your project is specifically site lighting, review our parking lot photometric plan guide for a more detailed breakdown of ratios, spacing, and permit concerns.
Common mistakes when reviewing a lighting photometric plan
- Looking only at average foot-candles: This hides poor uniformity and dark zones.
- Ignoring the calculation plane: A floor calculation and a work-plane calculation can tell very different stories.
- Skipping the IES assumptions: The wrong optic can make a plan look compliant while the installed result performs differently.
- Confusing lumens with delivered light on the surface: Lumens describe fixture output, not the final foot-candles on the task area.
- Missing property-line and spill-light issues: This is a common reason exterior plans fail review.
- Assuming brighter means safer: Excessive brightness can create glare, poor adaptation, and wasted energy.
- Treating the photometric plan like a complete construction set: It supports lighting design review, but other disciplines may still need separate engineering and detailing.
When to request a revised photometric plan
Ask for a revised plan when any core assumption changes. That includes fixture model changes, optic changes, mounting height revisions, pole relocations, site layout changes, owner light-level changes, or permit comments related to spill light, glare, or uniformity. Once those assumptions change, the old calculations stop being reliable.
At Stetra Lighting, we review photometric plans against real fixture data, fixture spacing, optics, glare control, and project intent so the final document is usable in the field and easier to defend during permit review. If you need a stronger submittal, see our professional photometric plan service or learn more about Stetra Lighting.
FAQ
What is the difference between a photometric plan and a lighting layout?
A lighting layout shows fixture placement. A photometric plan adds calculated performance data, such as foot-candles, lux, uniformity, and sometimes spill-light review. In practice, many people use the terms loosely, but a true photometric plan includes calculations.
What do foot-candles mean on a photometric plan?
Foot-candles measure how much light reaches a surface. On a photometric plan, each point value shows the predicted illumination at that location. For U.S. projects, foot-candles are the most common unit.
Should I review foot-candles or lux?
For U.S. projects, review foot-candles first. Lux is the metric equivalent and may appear on international projects or manufacturer data. The important part is using the same unit consistently against the project requirement.
What are iso-footcandle contours?
Iso-footcandle contours are lines that connect areas with similar light levels. They help you see light distribution patterns quickly, but they should always be checked against the point-by-point grid.
How do I read uniformity on a photometric plan?
Uniformity is usually shown as a ratio such as Avg/Min or Max/Min. Lower ratios generally mean the light is more even. A good review looks at the ratio together with the actual minimum light levels, not the ratio alone.
Why do IES files matter?
IES files contain the fixture’s photometric data. They define how the luminaire distributes light. If the wrong IES file is used, the photometric plan can look accurate while the real installation performs differently.
What makes a photometric plan permit-ready?
A permit-ready plan clearly identifies the fixtures, shows the calculation area and light levels, addresses relevant compliance issues, and presents a clean lighting layout that matches the intended submittal. It should be readable by reviewers, not just by the person who modeled it.
Can a photometric plan help reduce glare and spill light?
Yes. A good photometric plan helps you compare optics, mounting heights, shielding, and fixture spacing before installation. That makes it easier to reduce glare, control spill light, and improve uniformity without guessing in the field.
Need a permit-ready photometric plan?
Send us your site plan, target light levels, and fixture preferences. We will build a clear lighting layout with IES-based calculations, fixture spacing, glare control, spill-light review, and permit-ready documentation.
Final takeaway
The fastest way to read a photometric plan is to review it in sequence: area, fixtures, values, contours, ratios, and edge conditions. That approach tells you whether the design is bright enough, even enough, and controlled enough to support the project. If the assumptions are clear and the numbers hold up, the plan is useful. If they do not, you need revisions before the project moves forward.