
A car dealership photometric plan shows how light will perform across vehicle display rows, customer parking, drive aisles, frontage areas and perimeter zones before the fixtures are installed. The plan uses the actual IES photometric data for the selected luminaires to calculate point-by-point light levels across the site.
Dealership lighting is different from a normal parking lot. The vehicles themselves are part of the merchandise, so the display lot often requires higher illumination than customer parking or perimeter areas. At the same time, the design still needs to control glare, spill light and abrupt changes in brightness.
This guide explains how dealership lot lighting is calculated, what foot-candle and uniformity metrics matter, how pole height affects the layout, and how a real Stetra Lighting dealership project was designed and verified.
What Is a Car Dealership Photometric Plan?
A car dealership photometric plan is a computer-calculated lighting study of the exterior vehicle display lot and surrounding site. The designer models the property, buildings, parking rows, drive aisles and fixture locations, then calculates illuminance using the proposed luminaires’ IES files.
- pole and fixture locations
- mounting heights
- point-by-point foot-candle values
- average, minimum and maximum illuminance
- uniformity ratios
- display-lot and customer-parking zones
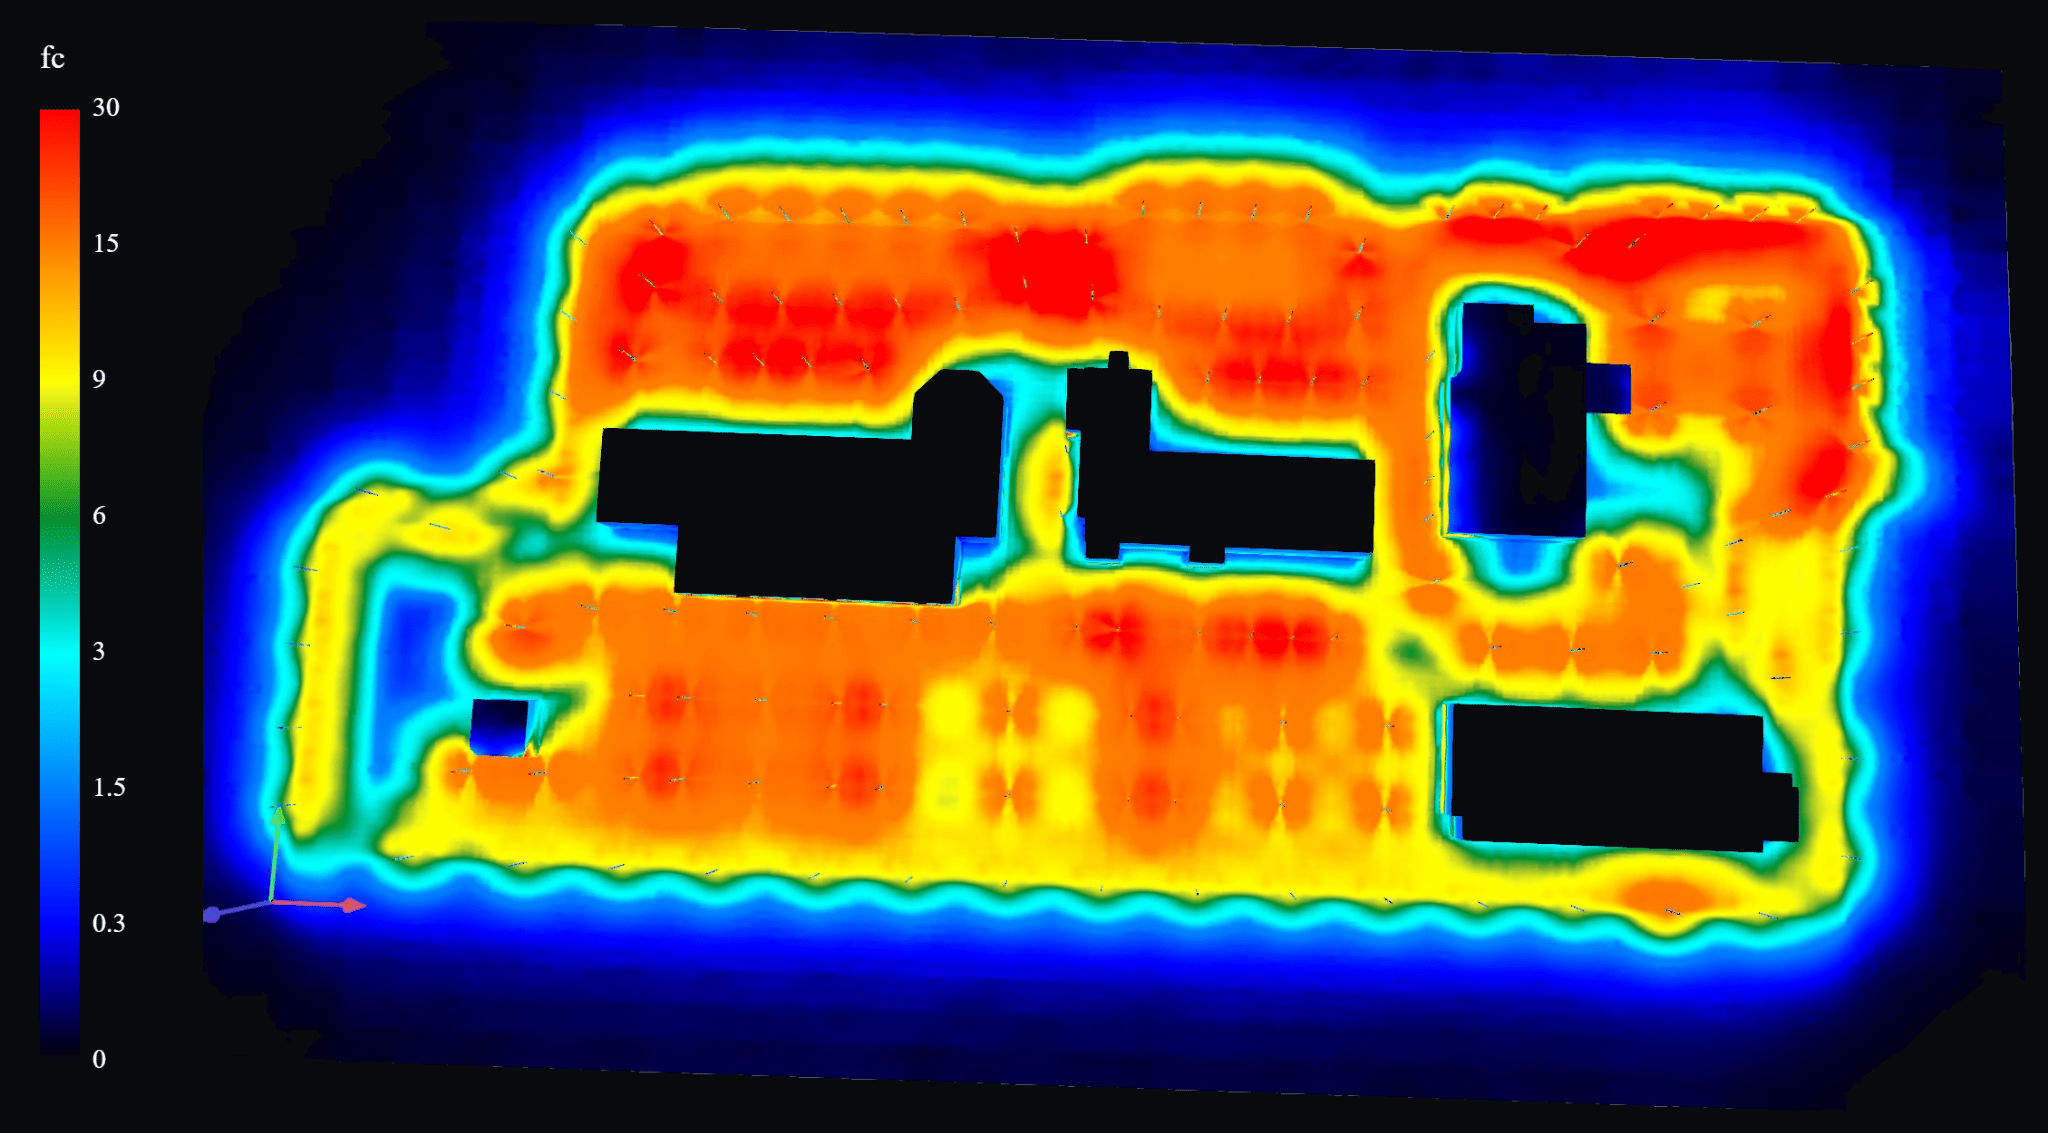
- false-color or iso-foot-candle distribution
- property-line light spill where required
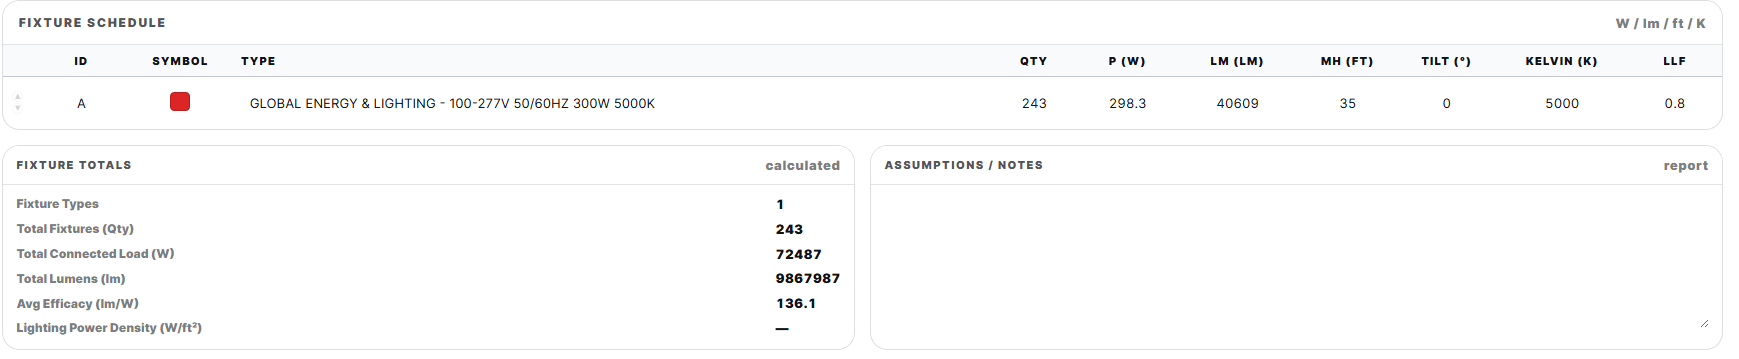
- fixture wattage, lumens, CCT and light-loss factor
- fixture totals and connected load
For the broader process, see our complete guide to photometric plans.
Why Car Dealership Lighting Is Different From Standard Parking-Lot Lighting
A dealership parking lot has two jobs: it must provide safe circulation, and it must present the vehicle inventory clearly after dark. That often means different calculation zones with different lighting priorities.
Vehicle display areas usually need stronger, more uniform illumination than ordinary customer parking. Drive aisles and perimeter areas can be lower, while frontage areas may need careful glare and spill-light control.
Current industry guidance also emphasizes treating display lots, customer parking and frontage as separate zones rather than relying on one overall site average. That is especially important on large dealership campuses.
Car Dealership Foot-Candles: What Level Is Typical?
| Dealership Area | Common Planning Range | Design Note |
|---|---|---|
| Exterior vehicle display lot | 20-50 fc | Higher illumination supports vehicle presentation after dark. |
| Customer parking / drive aisles | Lower than primary display areas | Should be coordinated with site circulation and local criteria. |
| Building entrances / facade zones | Project-specific | Often coordinated with brand visibility and pedestrian use. |
| Perimeter / property line | Jurisdiction-specific | Light trespass limits can be much lower than display-lot levels. |
The values above are general planning guidance, not universal code requirements. Final criteria should be confirmed for the actual project, owner standards and local jurisdiction.
Real Car Dealership Photometric Plan Example
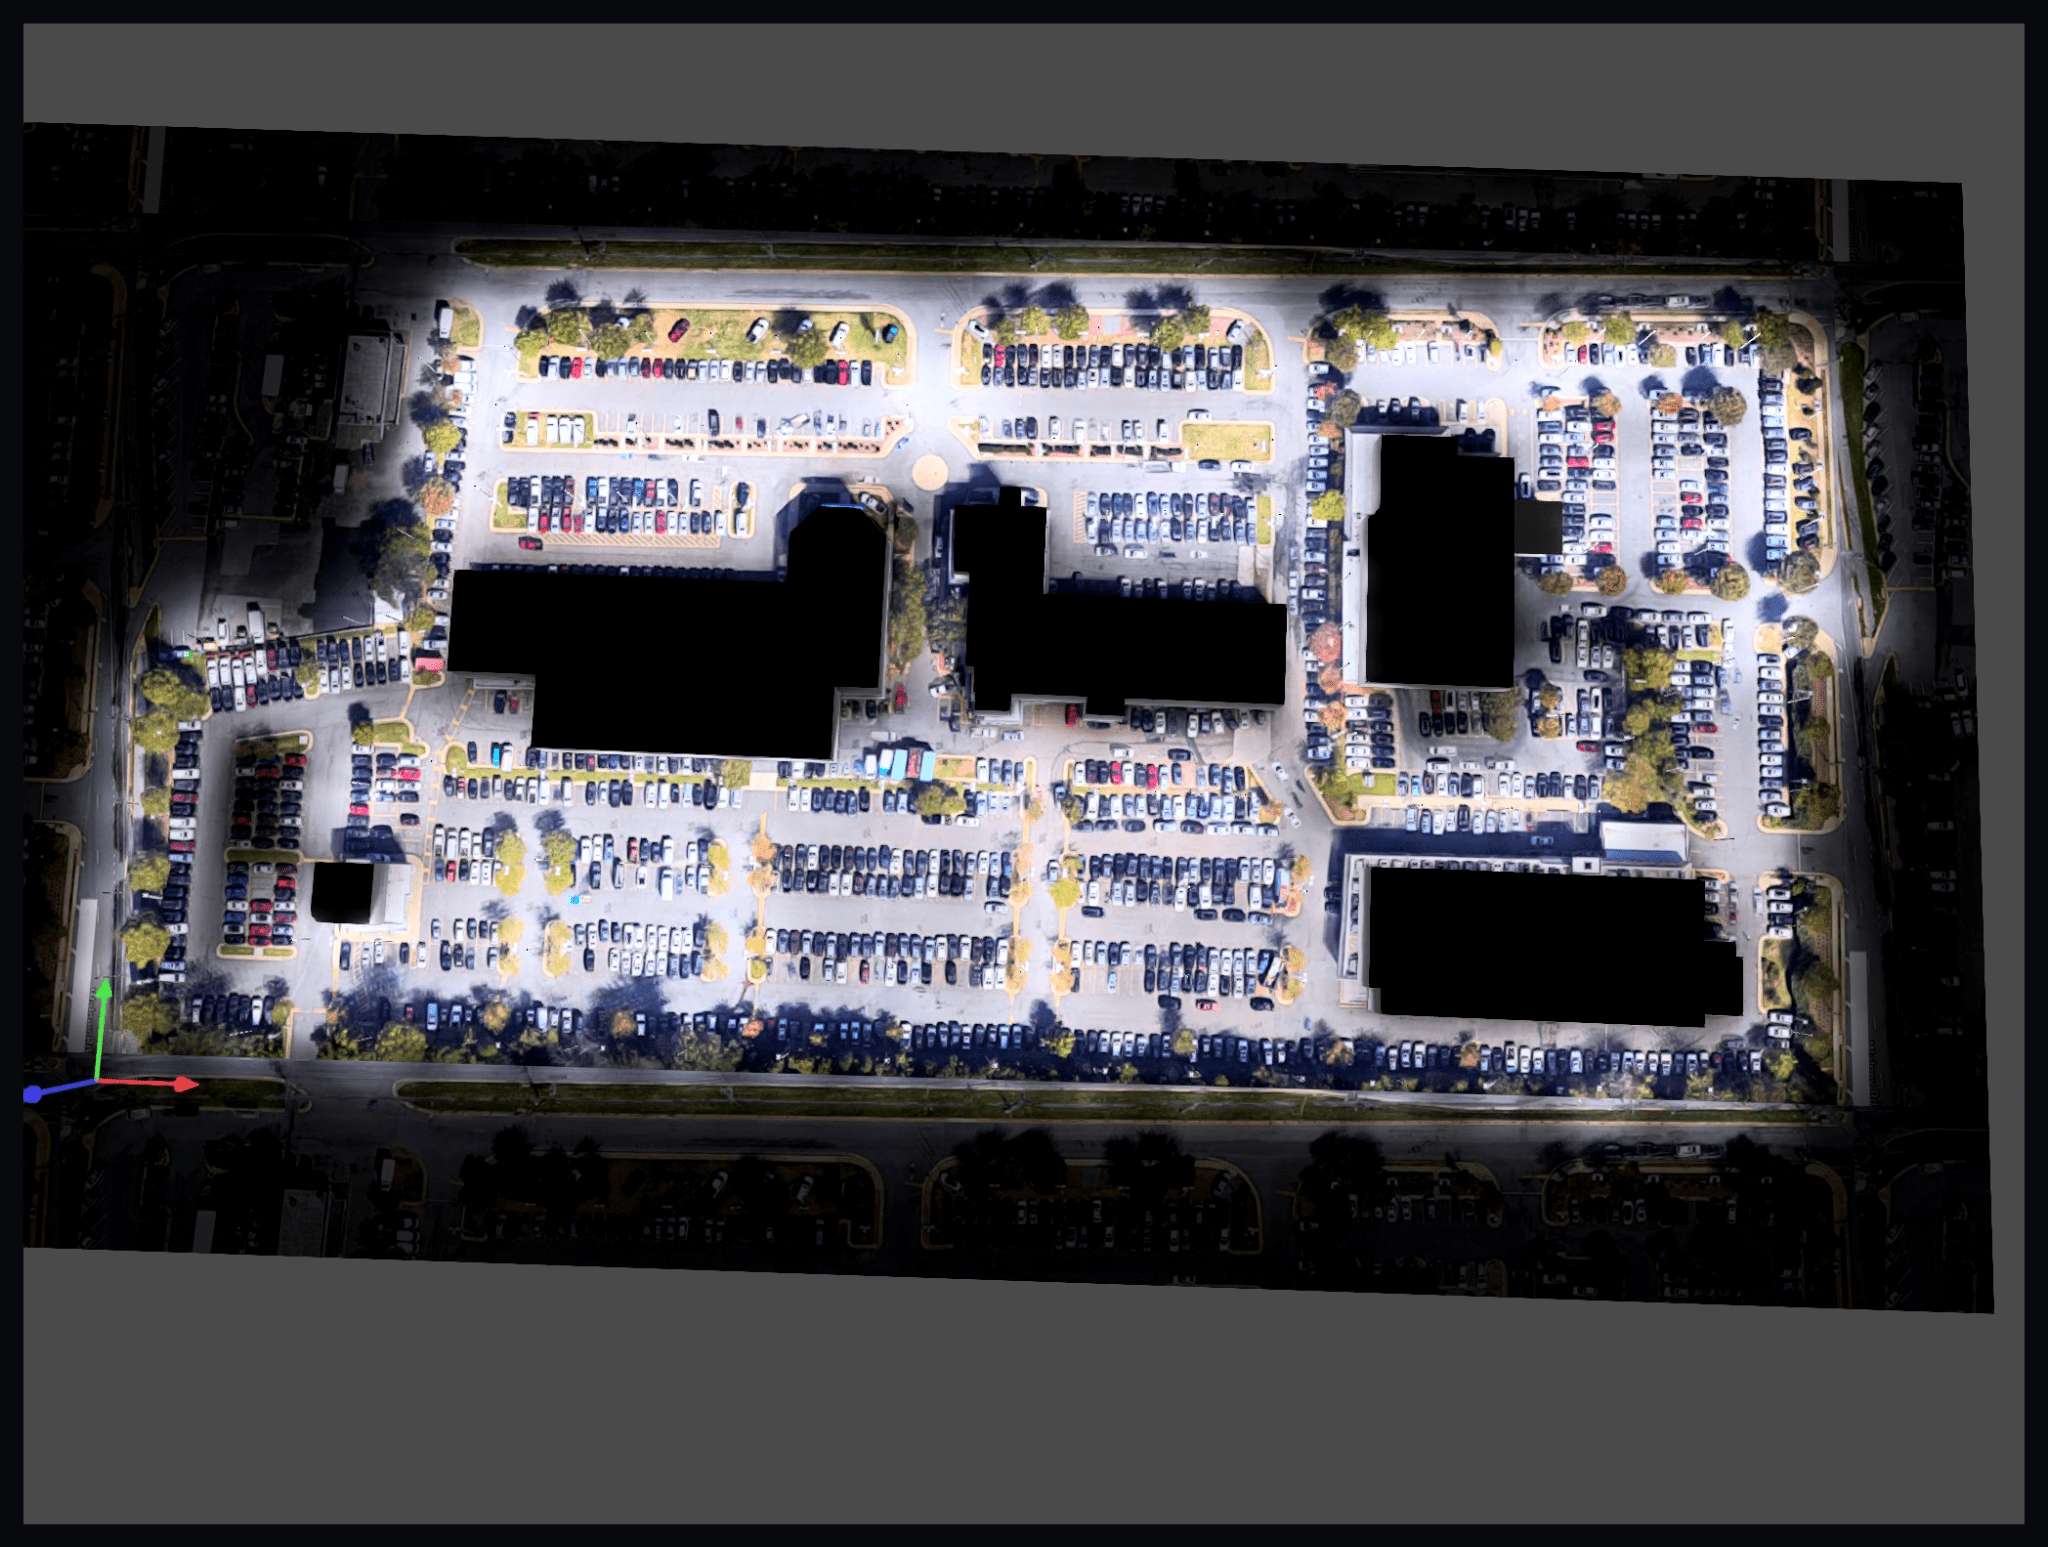
The project below is a real Stetra Lighting dealership study for a large multi-building automotive campus. The site contains extensive vehicle inventory, multiple dealership buildings, circulation drives and perimeter roads, making it a strong example of why dealership lighting should be treated as a multi-zone photometric problem.
Point-by-Point Foot-Candle Grid
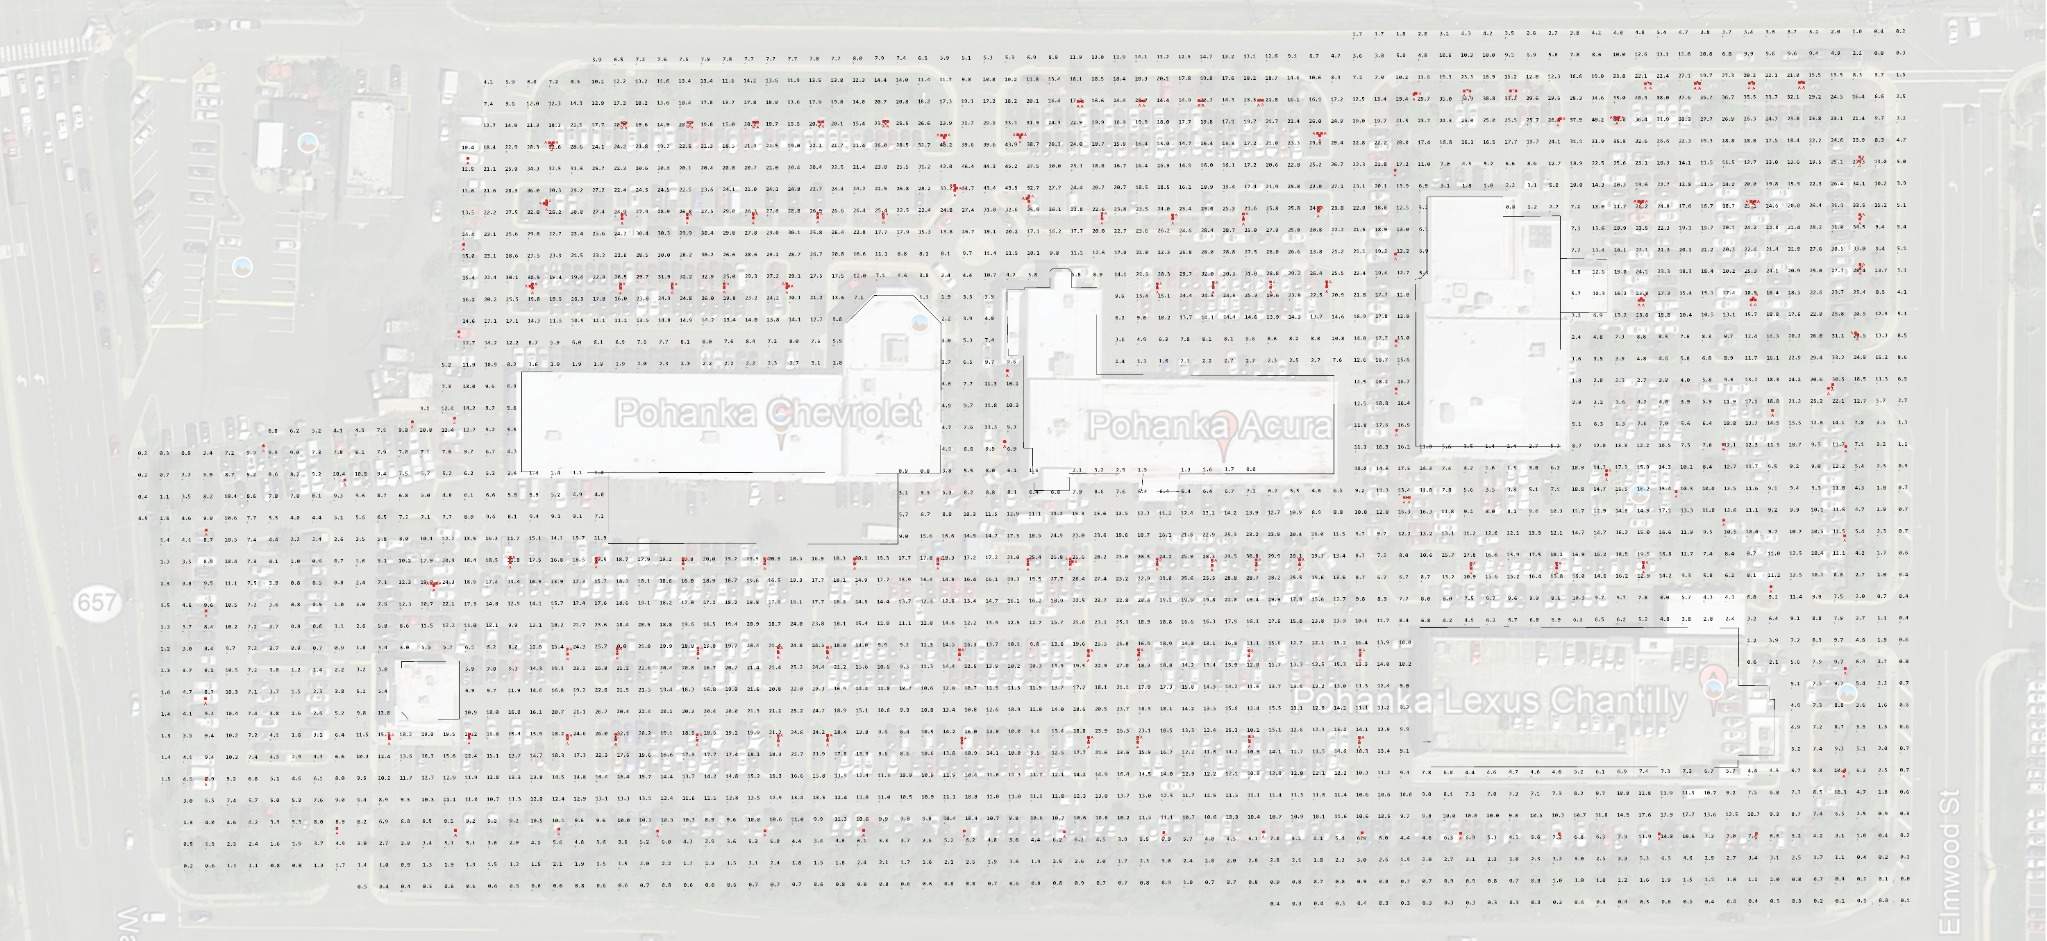
The point-by-point grid is the core technical output of the photometric plan. Each number represents calculated illuminance at that location. The grid makes it possible to see where the design is strong, where values drop between poles, and whether the transitions between display areas and perimeter zones are controlled.
Closer Look at the Vehicle Display Areas
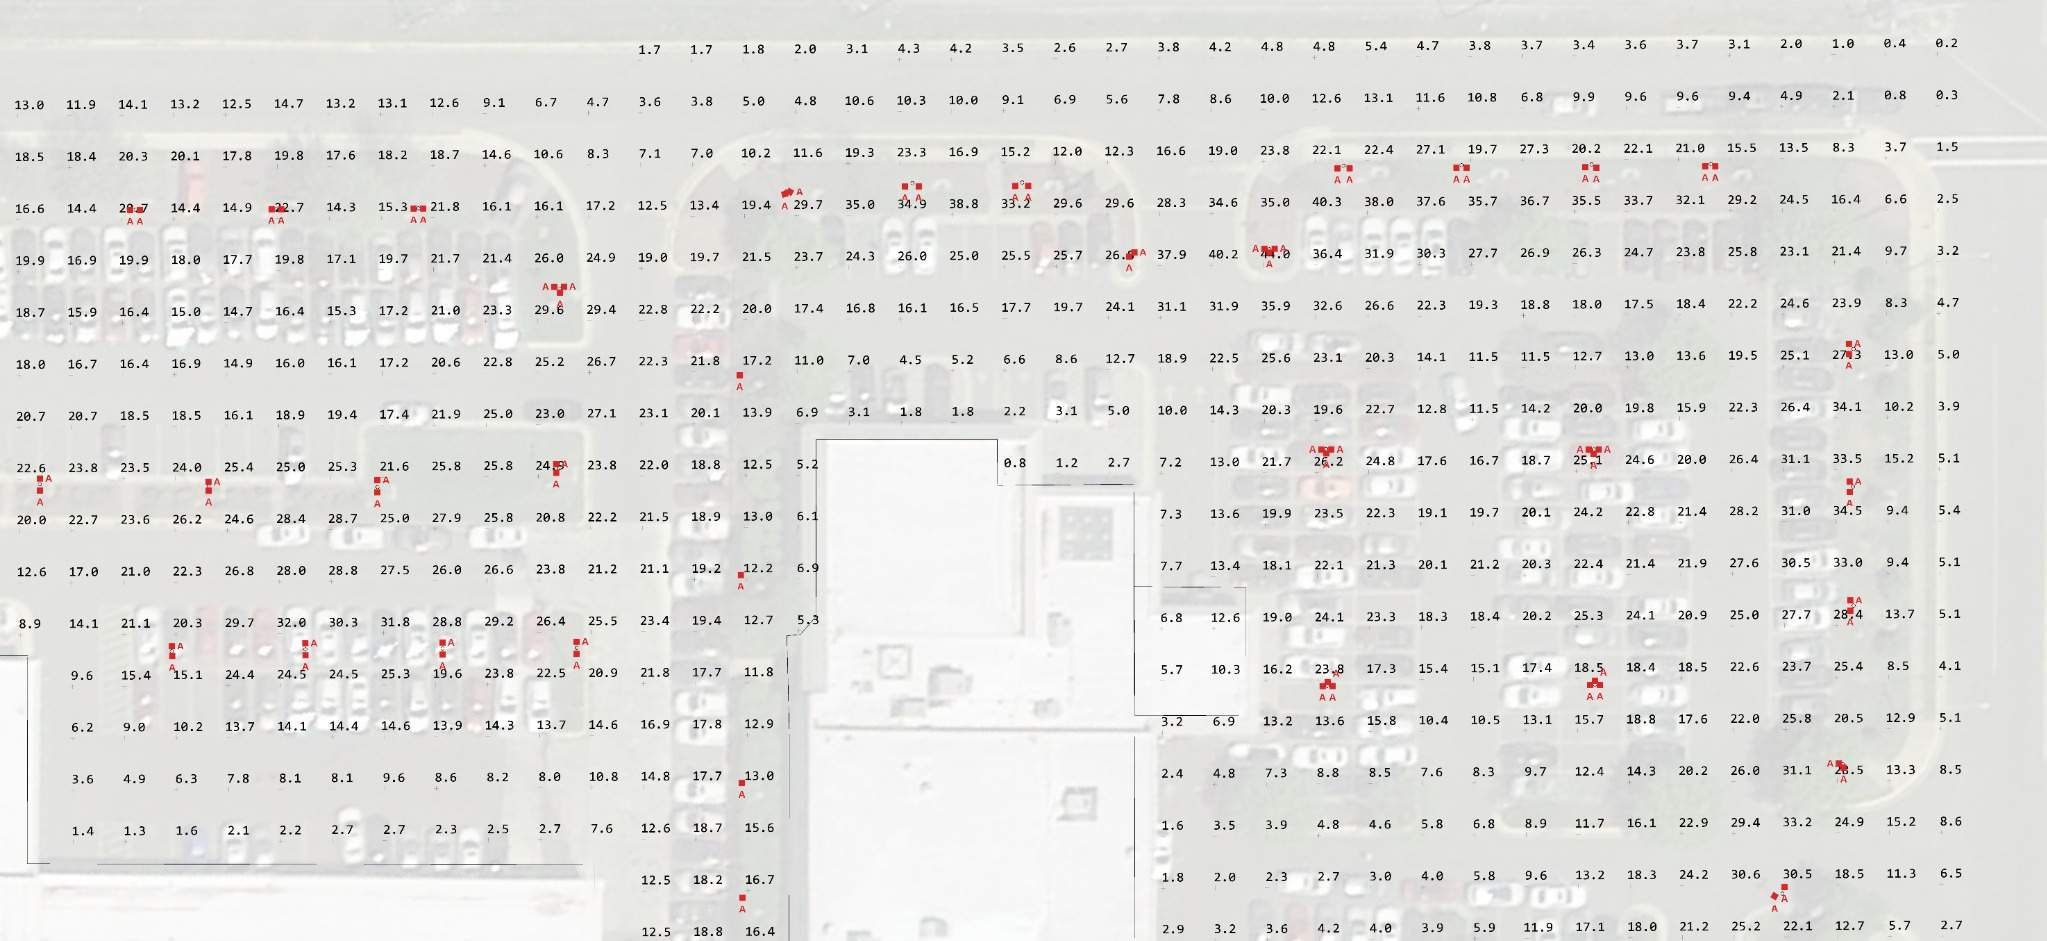
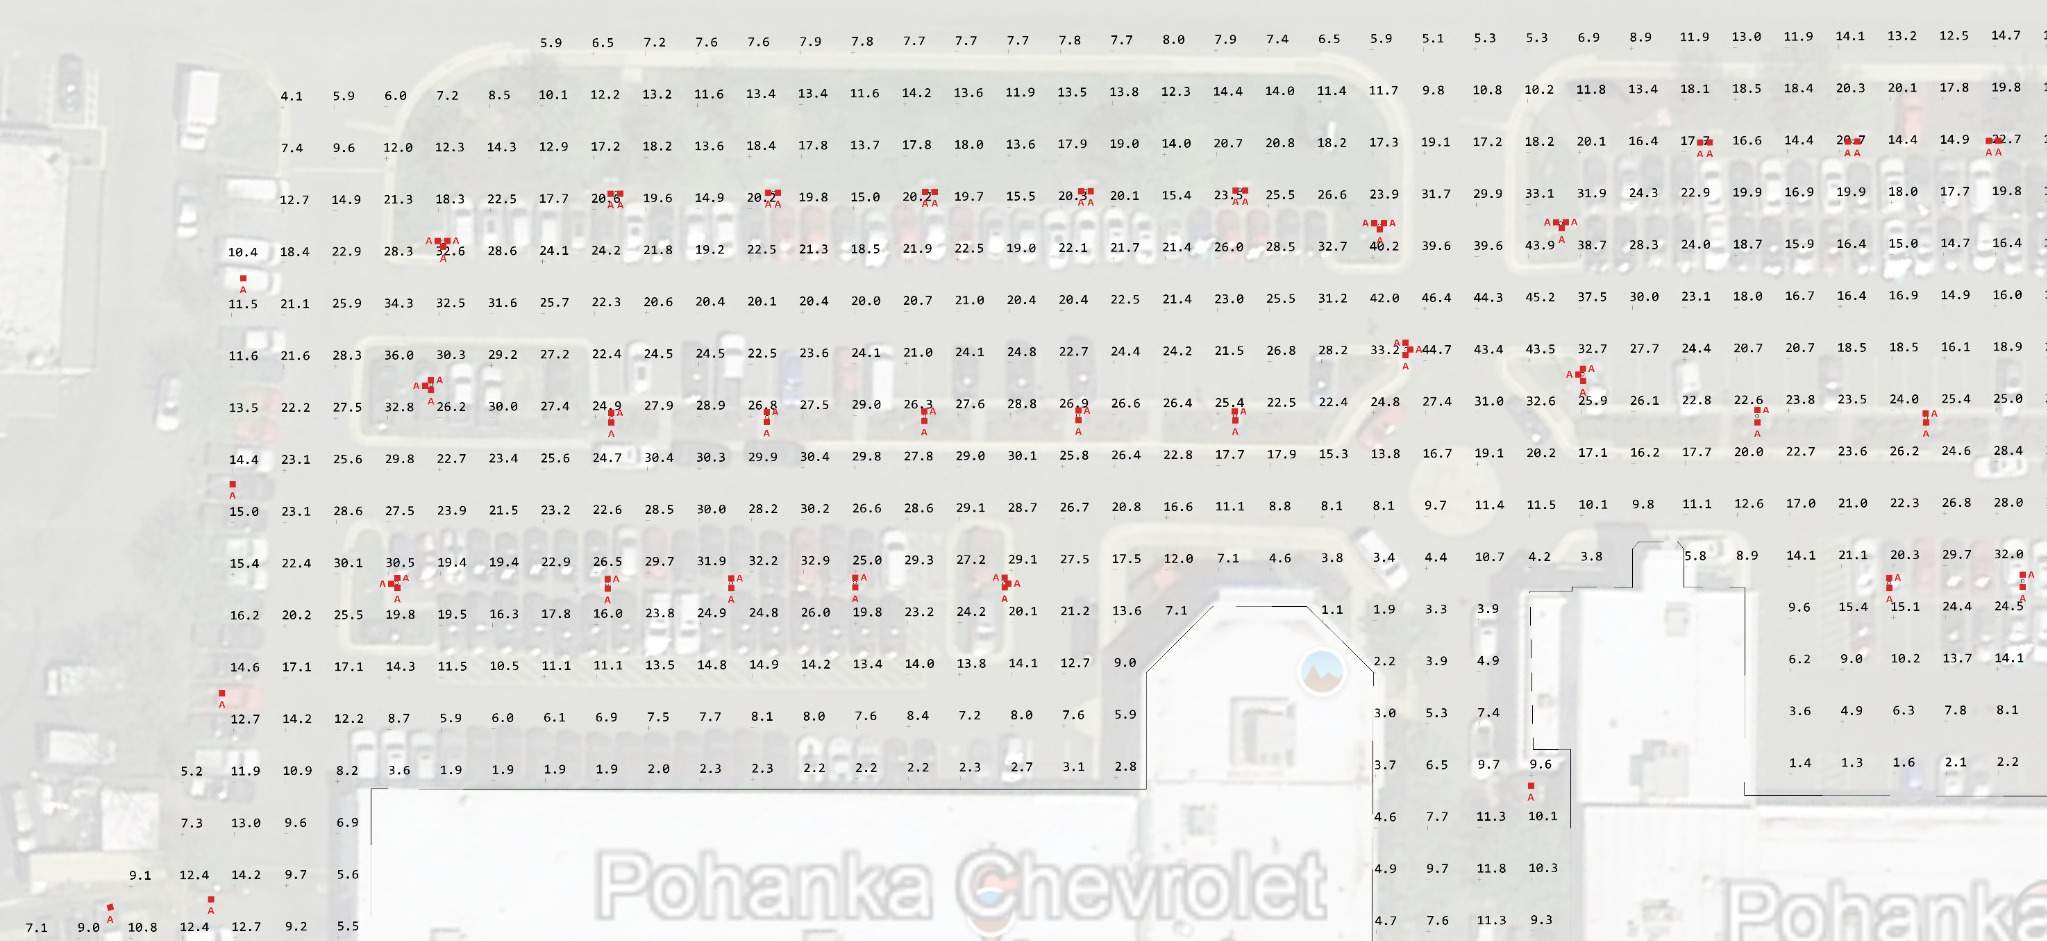
Calculated Site Result
The overall site average for this Stetra project was 12.7 foot-candles.
That number should not be interpreted as the target for every dealership or every display zone. It is the average across this specific project’s overall site calculation surface. Individual display rows contain much higher values, while perimeter and transition areas are lower.
Why Uniformity Matters at a Dealership
Uniformity affects both visibility and presentation. A dealership with bright hot spots directly under poles and dark gaps between them can still produce an acceptable average, but the site will not look evenly illuminated.
For a deeper explanation, see our guide to lighting uniformity ratios.
False-Color Analysis of the Dealership Lot
Fixture Schedule From the Real Project
- Quantity: 243 fixtures
- Input power: 298.3 W per fixture
- Lumen output: 40,609 lm per fixture
- Mounting height: 35 ft
- Color temperature: 5000 K
- Light-loss factor: 0.80
- Total connected load: 72,487 W
- Total lumens: 9,867,987 lm
- Average efficacy: 136.1 lm/W
Why 35-Foot Pole Height Matters
In this example, the main luminaires are mounted at 35 ft. A higher mounting height allows each fixture to cover a wider portion of the display lot, which can help reduce the number of poles and improve overlap between adjacent distributions.
Display-Lot Optics and Pole Spacing
Large dealership sites often use wide-area optics to cover multiple vehicle rows from tall poles. Type III, Type IV or Type V distributions may be appropriate depending on pole position, perimeter conditions and the direction in which the light needs to travel.
Light Trespass and Roadway Frontage
Dealership display lots are often intentionally bright, but the property line may be close to public roadways, neighboring commercial properties or residential areas. That makes perimeter control an important part of the photometric plan.
There is no single U.S. property-line limit that applies to every dealership. The correct limit must be confirmed from the local ordinance or project criteria.
Real Installed Result
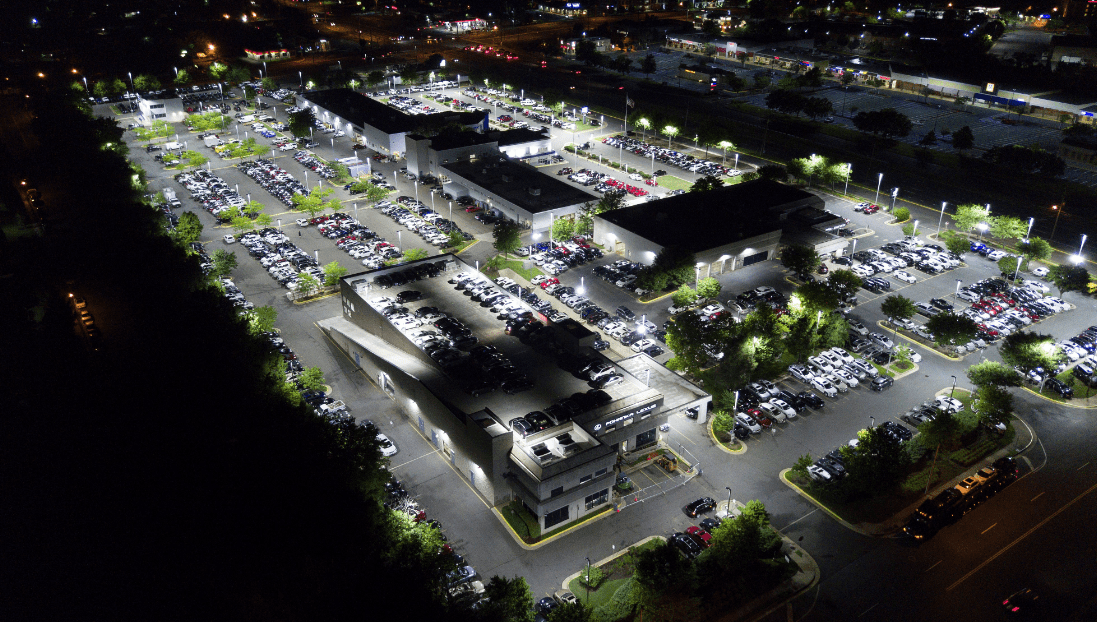
This completed-project image is especially useful because it shows the final installation after the design work. The inventory rows, circulation areas and building zones are clearly illuminated across the large dealership campus.
Why Car Dealership Lighting Should Be Designed by Zone
- front-row vehicle display
- general inventory parking
- customer parking
- drive aisles
- building entrances
- service areas
- employee parking
- perimeter security zones
- roadway frontage
Common Car Dealership Lighting Design Mistakes
- Using parking-lot targets for the entire dealership.
- Looking only at average foot-candles.
- Choosing fixtures by wattage.
- Ignoring perimeter spill.
- Using one calculation zone for the whole campus.
- Not modeling the actual pole height.
- Over-lighting to compensate for poor spacing.
What Information Is Needed for a Car Dealership Photometric Plan?
- Latest site plan or CAD file.
- Building footprints and vehicle-display areas.
- Existing or proposed pole locations.
- Pole mounting heights.
- Fixture model numbers and IES files, if selected.
- Frontage, customer-parking and inventory zones.
- Project city and state.
- Known zoning, property-line or permit requirements.
- Any owner-specific illumination criteria.
What Should the Final Dealership Photometric Report Include?
Depending on the project, the final report can include a site-plan overlay, point-by-point foot-candle grid, calculation summaries, fixture schedule, mounting heights, false-color analysis, 3D render, perimeter calculations and design notes.
When Should the Dealership Photometric Plan Be Prepared?
The best time is before the lighting package is finalized. This gives the project team time to adjust pole locations, mounting heights, fixture optics and quantities while the design is still flexible.
See when a photometric plan is typically needed.
How Much Does a Car Dealership Photometric Plan Cost?
The price depends on the overall site size, number of lighting zones, number of fixture types, property-line requirements and whether fixture selection or additional permit documentation is needed.
For Stetra’s broader pricing ranges and project examples, see our photometric plan cost guide.
Frequently Asked Questions
How many foot-candles should a car dealership lot have?
There is no universal number for every dealership. Exterior vehicle display areas are often planned at higher light levels than ordinary customer parking, commonly in the 20-50 fc range, but final targets should be based on owner standards, the project type and local requirements.
Why are dealership lots brighter than normal parking lots?
The vehicles are merchandise, so exterior lighting supports both visibility and presentation after dark.
What pole height works for dealership lighting?
It depends on site geometry and fixture performance. Large dealership lots commonly use taller poles because they can cover wider areas, but the final height should be tested using the fixture’s IES data and proposed spacing.
Should the dealership be divided into calculation zones?
Yes, especially on large sites. Display rows, customer parking, drive aisles, frontage and perimeter areas can have different lighting requirements and should be reviewed independently when appropriate.
Does a dealership photometric plan include property-line spill?
It can. When the jurisdiction or project requires it, the calculation can include perimeter points or separate property-line surfaces to document light trespass.
Can existing poles be reused in an LED retrofit?
Often, yes. A photometric model can test new LED fixtures on the existing pole locations and heights to determine whether the proposed replacement provides suitable coverage and uniformity.
Request a Car Dealership Photometric Plan
Stetra Lighting prepares professional car dealership photometric plans using actual site geometry, IES files and point-by-point calculations.
Send the site plan, pole layout, mounting heights, fixture information and project location. We can review the scope and determine which display-lot, customer-parking and perimeter calculations are needed.
Use the Request a Photometric Plan button in the article navigation to send your dealership project for review.