
A car wash photometric plan shows how much light reaches the wash bays, vehicle approach areas, circulation zones and surrounding property before the lighting is installed. Instead of relying only on fixture wattage or a visual layout, the plan uses manufacturer IES files and a scaled site model to calculate actual foot-candle levels across the project.
For car wash projects, this matters because lighting conditions change quickly from one part of the site to another. Covered wash areas can require strong, uniform illumination, while exterior areas must still be bright enough for circulation without creating unnecessary spill light toward neighboring properties.
The images below are from a real Stetra Lighting project and show the same design in several ways: 3D rendering, point-by-point calculations and false-color analysis.
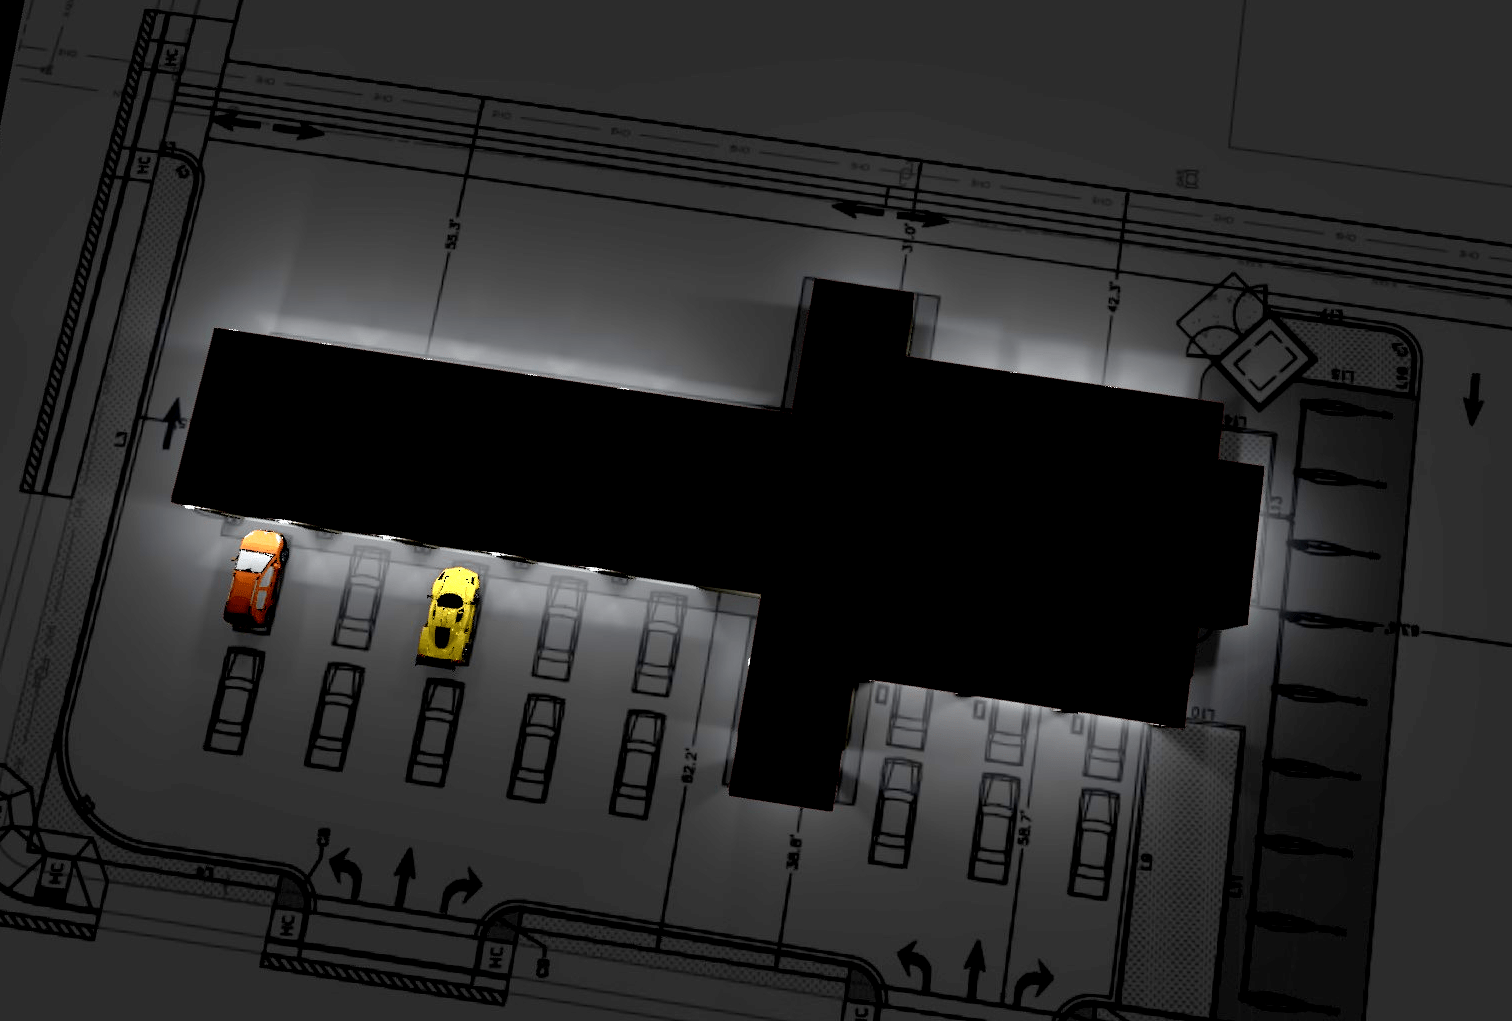
What Is Included in a Car Wash Photometric Plan?
A professional car wash photometric plan normally combines the site layout, fixture locations, mounting information and calculated light levels into one coordinated lighting study.
- Average, minimum and maximum foot-candle levels
- Lighting uniformity inside covered wash areas
- Dark spots between fixtures
- Excessive hot spots directly below luminaires
- Vehicle approach and circulation lighting
- Light spill outside the intended area
- The effect of fixture mounting height and distribution
- Whether the selected IES files perform as expected
The exact lighting criteria should always be confirmed for the project, owner requirements and local authority having jurisdiction. A photometric plan is the tool used to test the proposed design against those criteria. For a broader explanation, see our photometric plan guide.
Real Car Wash Photometric Calculation Example
For this project, the photometric model included separate calculation areas so that the covered car wash zones could be reviewed independently from the broader site.
| Calculation Area | Average | Maximum | Minimum | Avg/Min | Max/Min |
|---|---|---|---|---|---|
| Car wash site area | 3.67 fc | 45.0 fc | 0.005 fc | — | — |
| Car wash cabin area 1 | 18.3 fc | 22.4 fc | 12.7 fc | 1.44 | 1.76 |
| Car wash cabin area 2 | 31.6 fc | 46.2 fc | 20.2 fc | 1.56 | 2.29 |
These values are project-specific calculation results, not universal car wash requirements. They show why it is useful to separate the wash areas from the overall site. A site-wide minimum can fall very low at the outer limits of the calculation grid even when the active wash areas maintain much stronger and more uniform illumination.
Point-by-Point Foot-Candle Calculations
The point-by-point plan is one of the most important sheets in a car wash photometric study. It places calculated foot-candle values directly over the scaled drawing so the lighting designer, owner or reviewer can see where the light is actually reaching the ground.
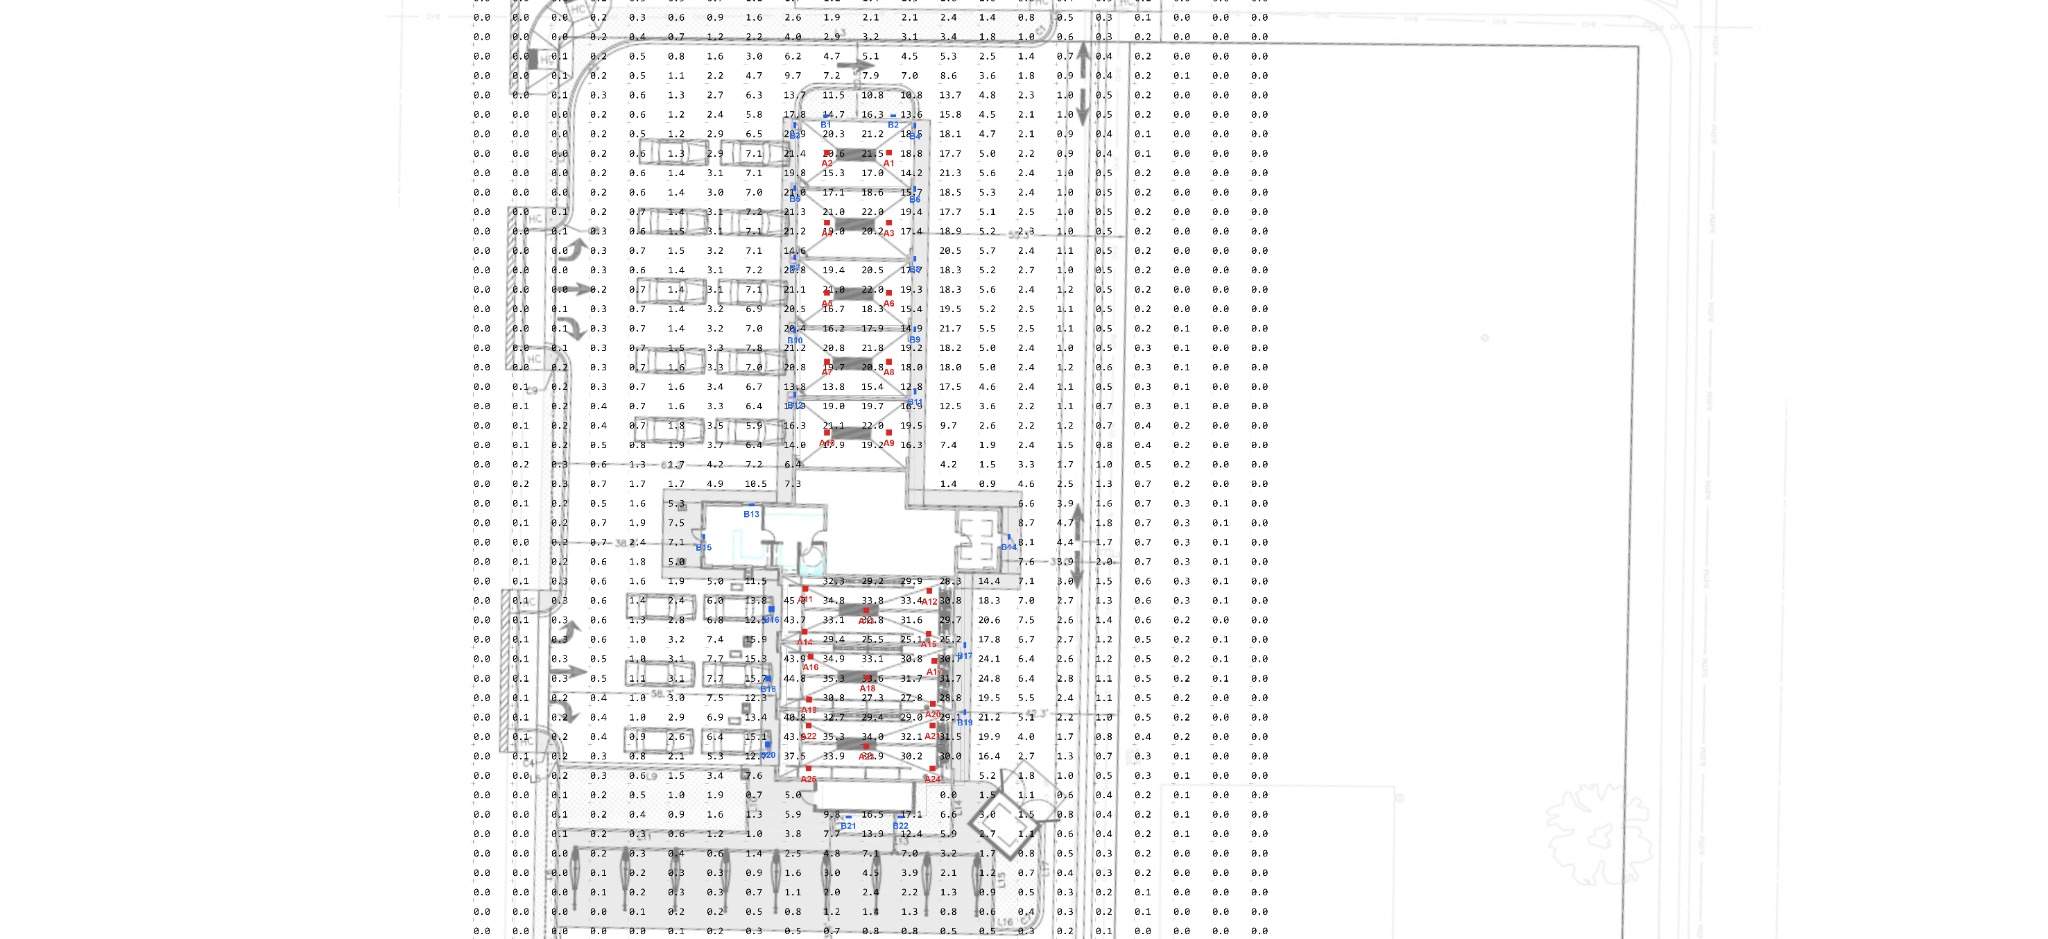
A detailed view is especially useful around the wash structure because it makes it easy to compare fixture positions with the calculated values.
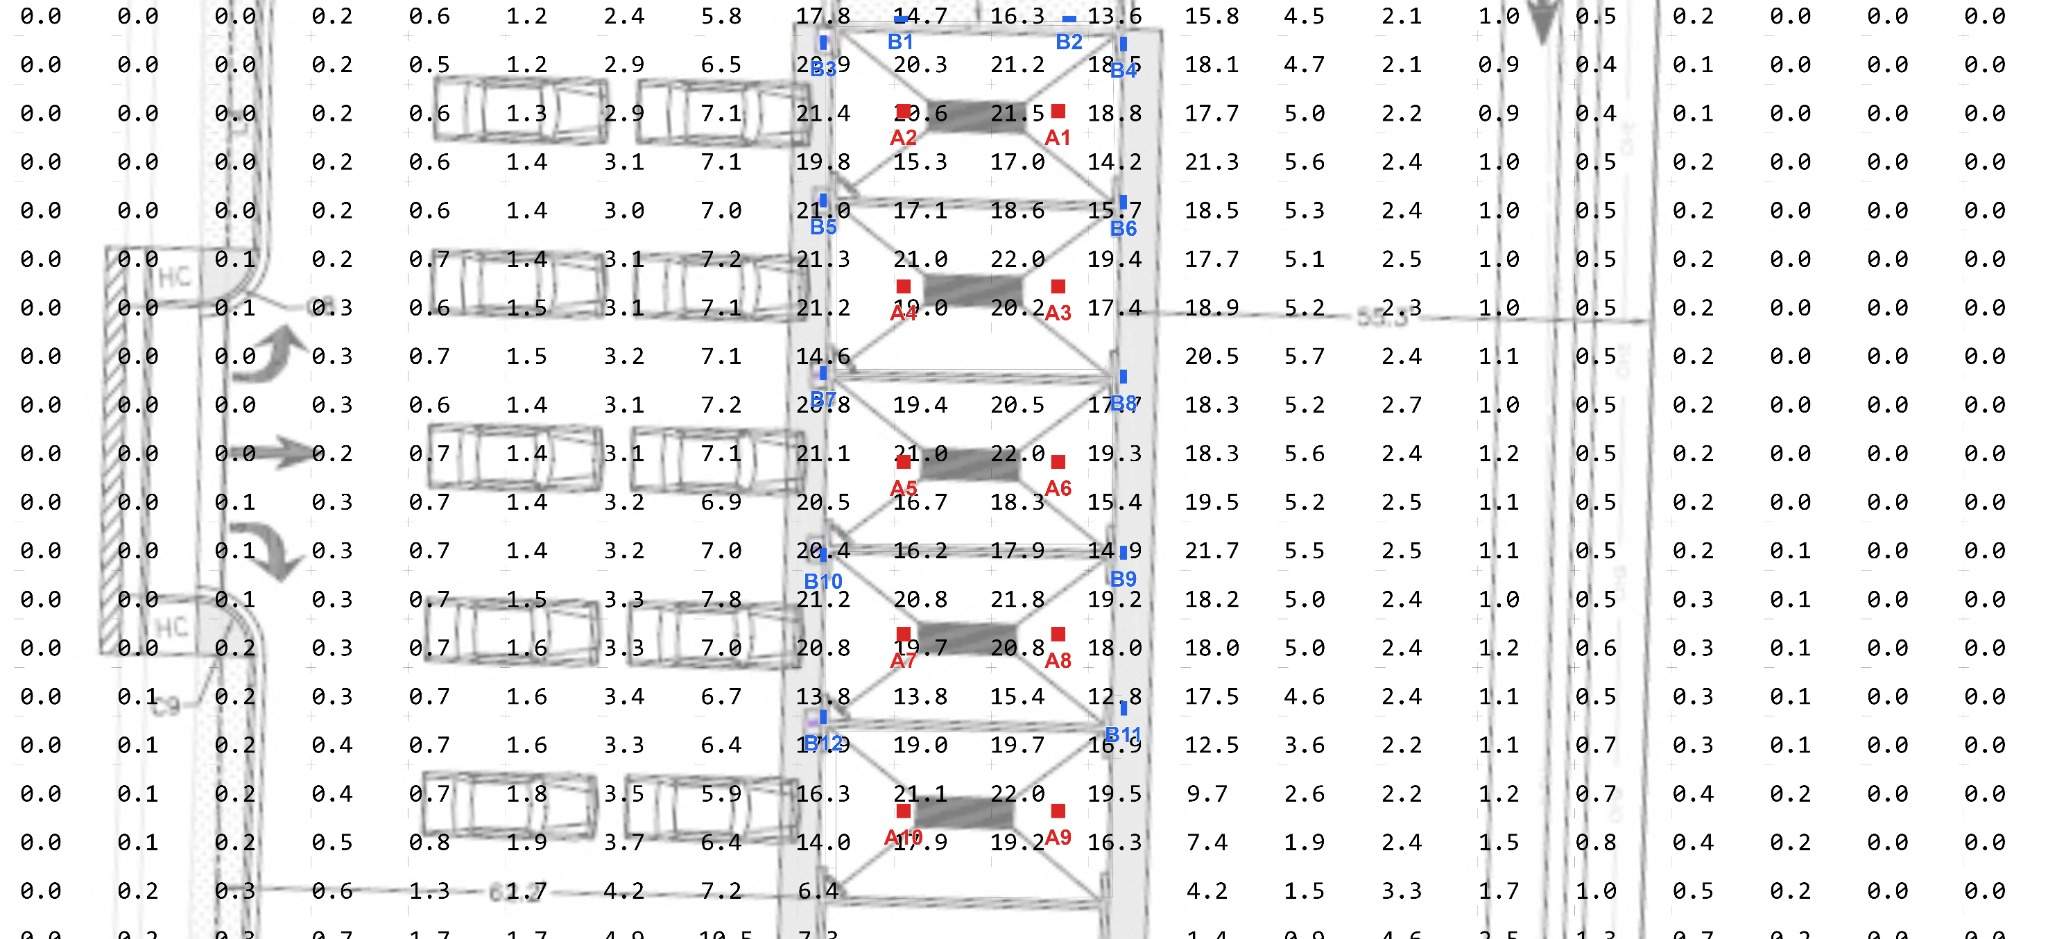
This view can reveal conditions that are easy to miss on a fixture layout alone. Two luminaires may appear evenly spaced in plan view while their optical distributions create a bright overlap in one area and a lower level between them.
Why Uniformity Matters in a Car Wash
Average light level alone does not describe how comfortable or functional a space will feel. If one part of a wash bay is very bright and the next section drops sharply, drivers and staff experience repeated changes in brightness. That is why photometric reports also review minimum values and lighting uniformity ratios.
In this project, the two covered calculation areas produced average-to-minimum ratios of 1.44:1 and 1.56:1. Those project results indicate that the calculated values inside each selected cabin area stay relatively close to their respective averages.
False-Color Analysis Makes the Distribution Easy to Read
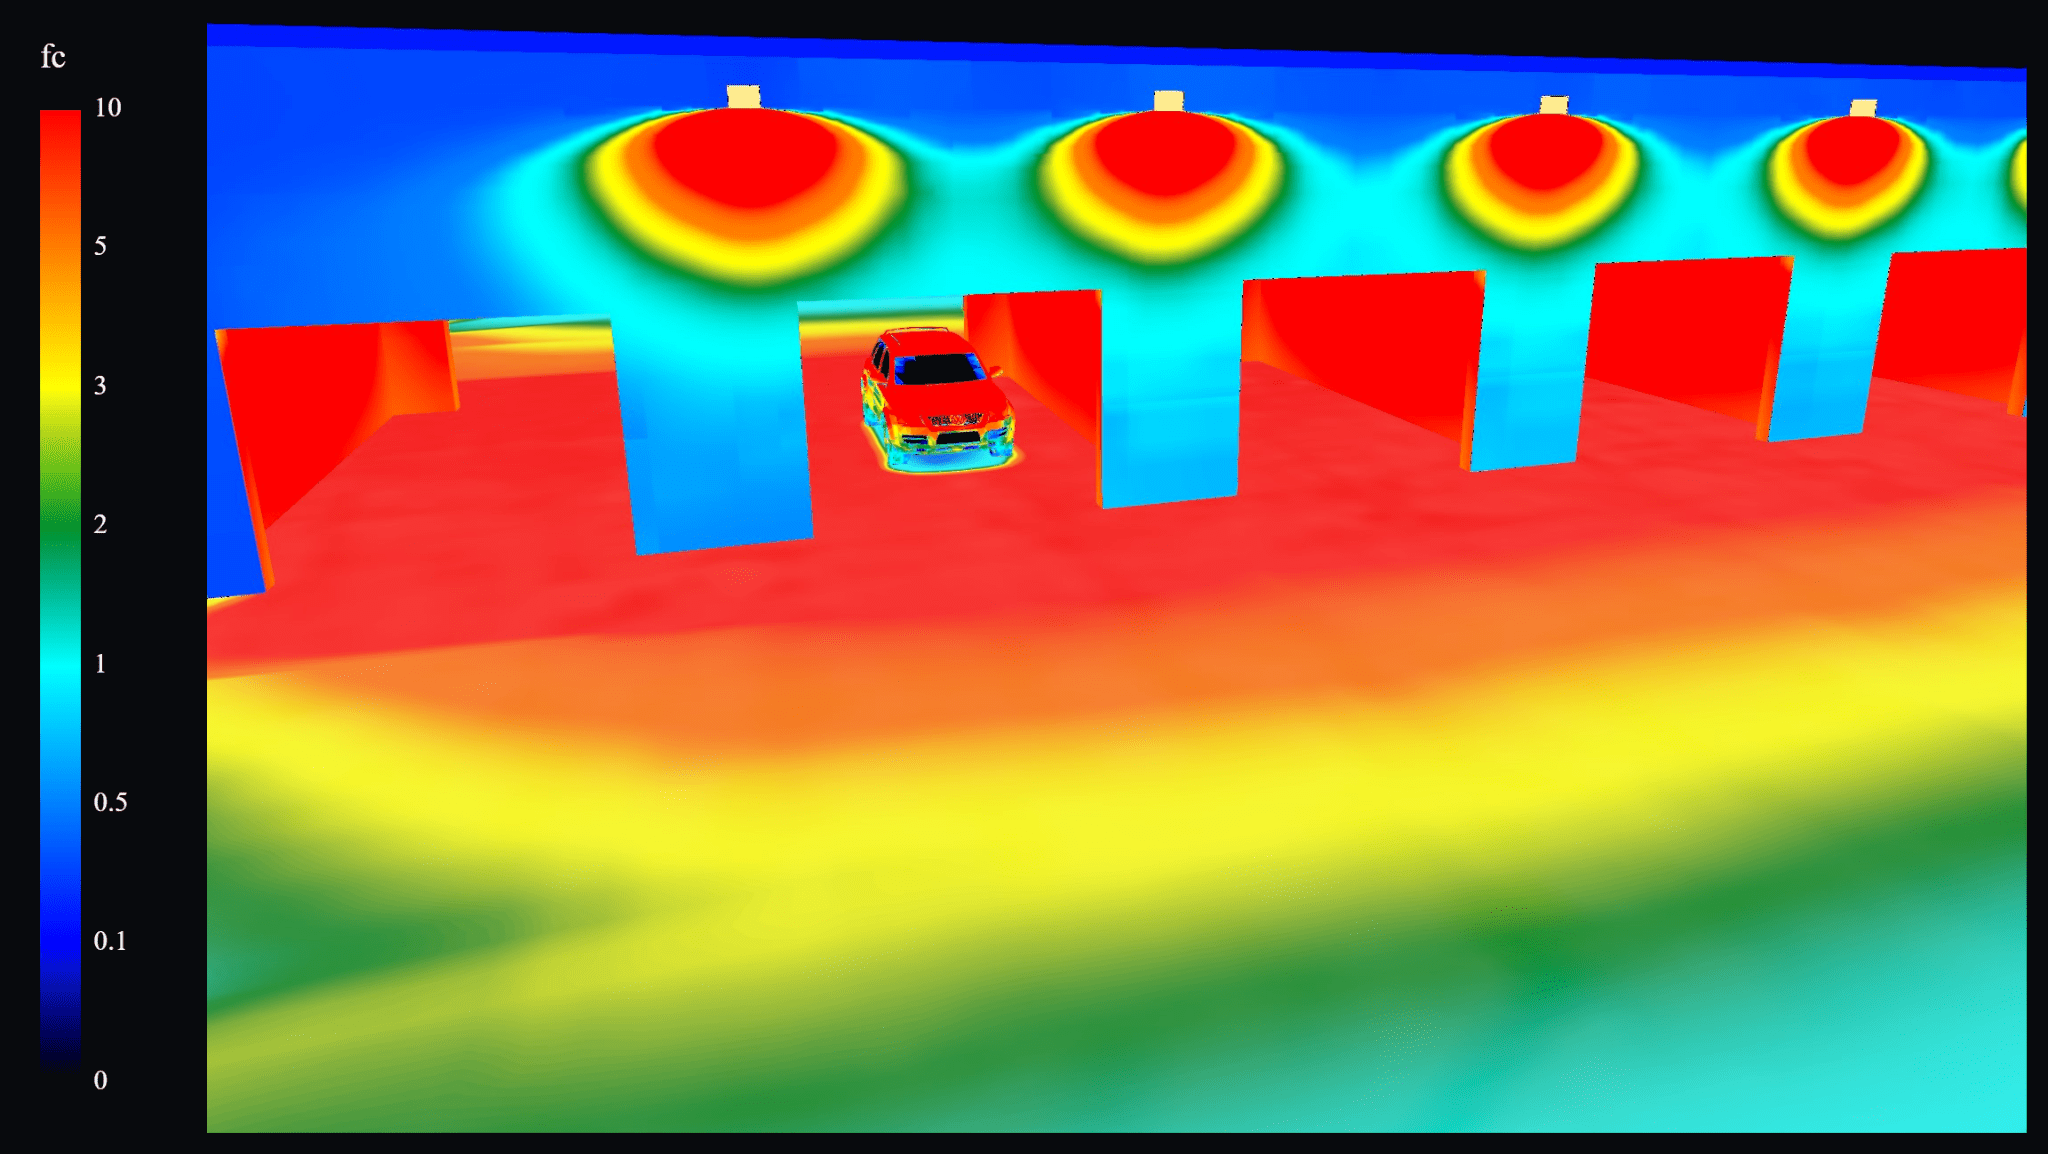
A false-color view converts calculated illumination into a visual heat map. Instead of reading hundreds of individual numbers, the designer can immediately see how light transitions from higher to lower levels.
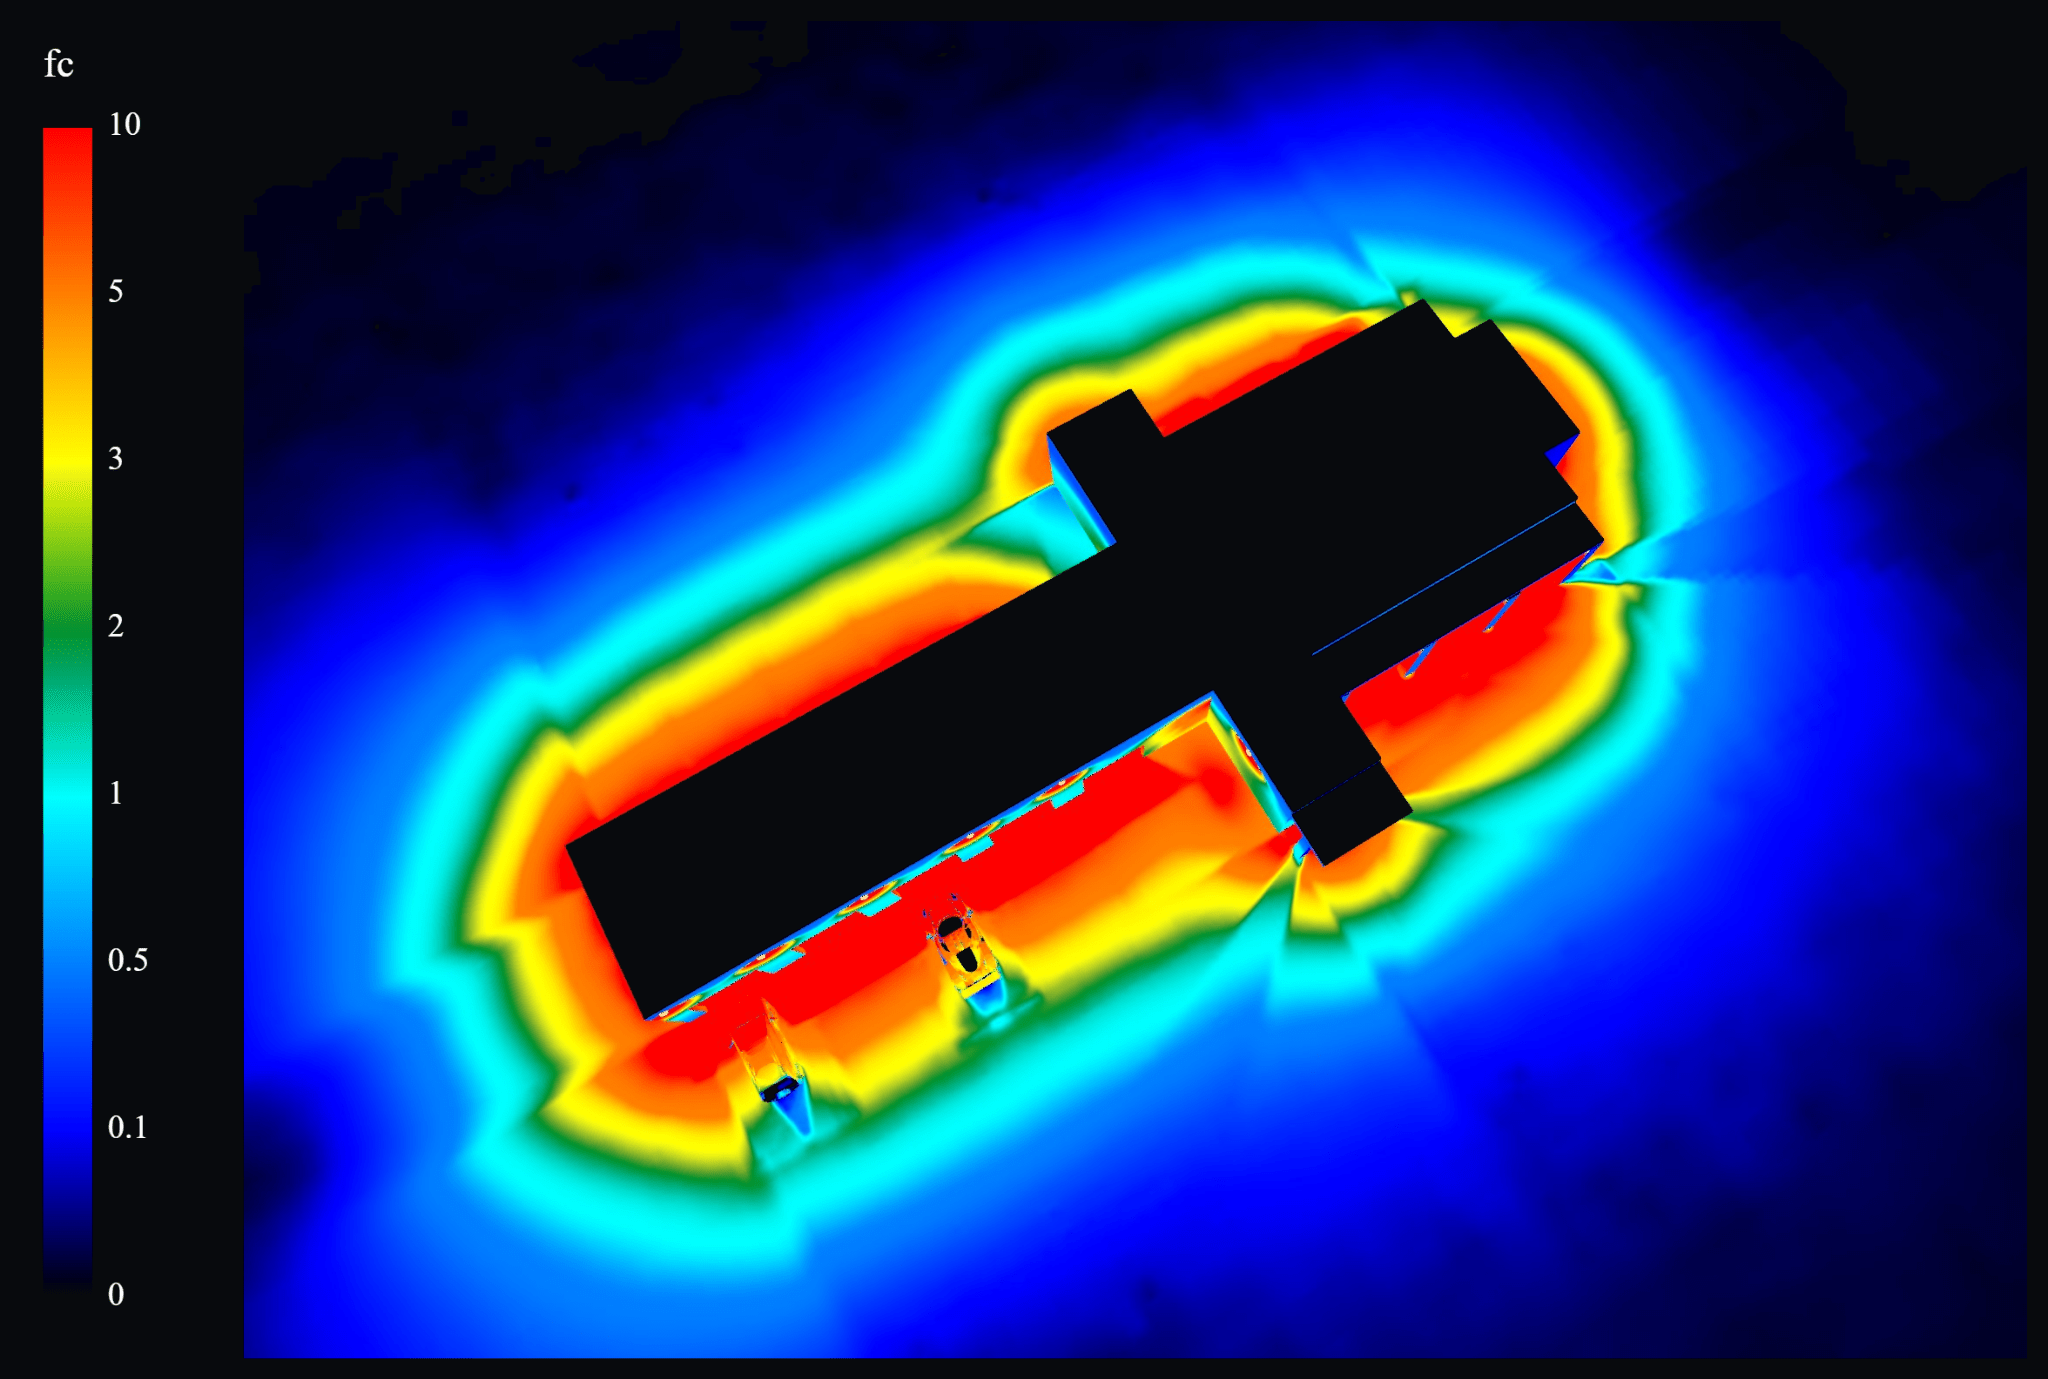
In the aerial image, the strongest light is concentrated close to the building and active vehicle areas, while the levels reduce progressively toward the edge of the site. This type of view is useful for checking both coverage and light spill.
Car Wash Lighting Is More Than Choosing Wattage
Two fixtures with the same wattage can produce very different photometric results. The final distribution depends on the fixture’s optics, mounting height, tilt, lumen output and IES file. A lower-wattage fixture with the right distribution can sometimes perform better than a higher-wattage fixture with unsuitable optics.
For that reason, Stetra Lighting models the actual fixture photometry rather than estimating performance from wattage alone. This is also why an IES-based calculation is useful before fixtures are purchased: fixture locations, optics, output and mounting conditions can be tested before installation.
Exterior Areas and Light Spill
A car wash often operates during evening or nighttime hours, so exterior lighting needs to support vehicle movement while also respecting adjacent properties. The photometric grid can be extended beyond the active drive lanes and around the site perimeter to show how quickly illumination falls off.
Where a jurisdiction has specific property-line or light-trespass limits, those values should be entered as project criteria and verified directly in the calculation.
What We Need to Prepare a Car Wash Photometric Plan
The most useful starting information is a scaled PDF or DWG site plan, the building or canopy layout, proposed fixture locations if already known, mounting heights and fixture cutsheets or IES files.
If the fixtures have not been selected yet, the lighting can also be developed around the project goals and then refined once suitable products are chosen. For permitting work, it also helps to provide city comments or lighting ordinance requirements so the report can be formatted around the criteria the reviewer expects to see.
Typical Final Deliverables
- Point-by-point foot-candle plan
- Average, maximum and minimum calculations
- Uniformity ratios for selected areas
- Fixture locations and mounting information
- Luminaire schedule
- False-color lighting analysis
- 3D or rendered views
- Property-line calculations when required
- Project notes and calculation assumptions
Need a Car Wash Photometric Plan?
Stetra Lighting prepares professional IES-based photometric plans for car washes, parking lots, gas stations, commercial sites and other exterior lighting projects.
If you already have a site plan, fixture information or city comments, upload them and we can review the project scope.
Frequently Asked Questions
What is a car wash photometric plan?
It is a calculated lighting plan showing expected foot-candle levels across the car wash, wash bays and exterior site using the actual fixture photometry.
Does a car wash photometric plan show uniformity?
Yes. Selected calculation areas can report average, maximum and minimum illumination together with average-to-minimum and maximum-to-minimum ratios.
Can the plan check light spill at the property line?
Yes. Calculation points can be extended to property lines or other required boundaries so spill light can be evaluated against the applicable project criteria.
Do you need the exact light fixtures before starting?
Not always. If fixtures are already selected, their IES files can be modeled directly. If they are not selected, a preliminary layout can be developed and then refined around suitable fixtures.
Can the photometric plan be used for permit review?
Photometric plans are commonly included in permit, planning or design-review submissions when the local authority requests lighting calculations. The required format and criteria vary by jurisdiction.