Lighting uniformity ratio shows how evenly light is distributed across a space. It measures the relationship between the brightest and darkest points on a photometric plan.
This guide explains what Avg/Min and Max/Min ratios mean, how they affect visibility and safety, and how designers use them to evaluate and optimize lighting layouts. If you ever searched for “lighting uniformity ratio explained,” this article walks you through the essentials. When uniformity ratios are required for permits or safety compliance, they should be verified through a professional photometric plan rather than assumed from fixture spacing alone.
What Is Lighting Uniformity Ratio?
Uniformity ratio compares light levels in different areas of a room, site, or warehouse. Instead of relying only on average foot-candles, the uniformity ratio reveals how consistent the lighting feels across the entire area. A low ratio means light is distributed smoothly without noticeable dark spots.

How Designers Use Uniformity Ratios
Uniformity ratios appear in nearly all lighting standards. They help determine whether a lighting layout feels safe, comfortable, and visually balanced. Designers use these values as part of professional lighting design services to avoid harsh contrast, dark pockets, and glare — issues that impact real-world usability.
- Avg/Min shows how the average level compares to the darkest point.
- Max/Min shows how the brightest point compares to the darkest point.
- Lower ratios (closer to 1:1) indicate smoother, more even light.
Here are the two main uniformity types:
| Uniformity Ratio Type | Formula | Meaning |
|---|---|---|
| Average-to-Minimum (Avg/Min) | Average fc ÷ Minimum fc | Indicates overall smoothness of illumination. |
| Maximum-to-Minimum (Max/Min) | Maximum fc ÷ Minimum fc | Shows contrast between hot spots and dark spots. |
Avg/Min vs Max/Min: How to Read the Numbers
Photometric plans list three key values: average, maximum, and minimum foot-candles. From these, the software calculates Avg/Min and Max/Min ratios. These numbers help determine whether the lighting layout meets the target standard and provides adequate visibility.
- Avg/Min — the main indicator for usable, comfortable lighting.
- Max/Min — identifies extreme contrasts and potential glare.
- Target ranges — vary by application and safety requirements.
Here are typical design targets:
| Application | Avg/Min Target | Max/Min Target | Design Note |
|---|---|---|---|
| Parking lots | 3:1 to 4:1 | 10:1 or better | Reduces dark corners and improves pedestrian safety. |
| Warehouses | 2:1 to 3:1 | 8:1 or better | Supports visibility on racks and aisles. |
| Open offices | 1.6:1 to 2.5:1 | 5:1 or better | Reduces eye strain and glare at workstations. |
| Sports fields | 2:1 to 3:1 | 8:1 or better | Ensures visibility for players and spectators. |
Practical Tips for Better Uniformity
You can improve uniformity by adjusting pole spacing, aiming angles, optics, and fixture locations. Even small changes can significantly reduce contrast without increasing the number of fixtures.
- Check for even spacing of fixtures or poles.
- Select optics appropriate for the layout and task.
- Balance energy savings with uniformity requirements.
Real Warehouse Example: Improving Uniformity with a New Layout
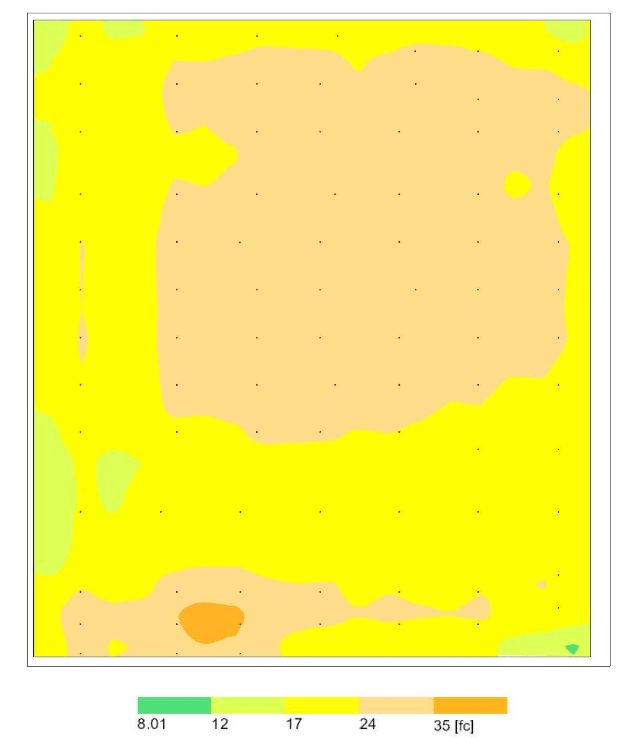
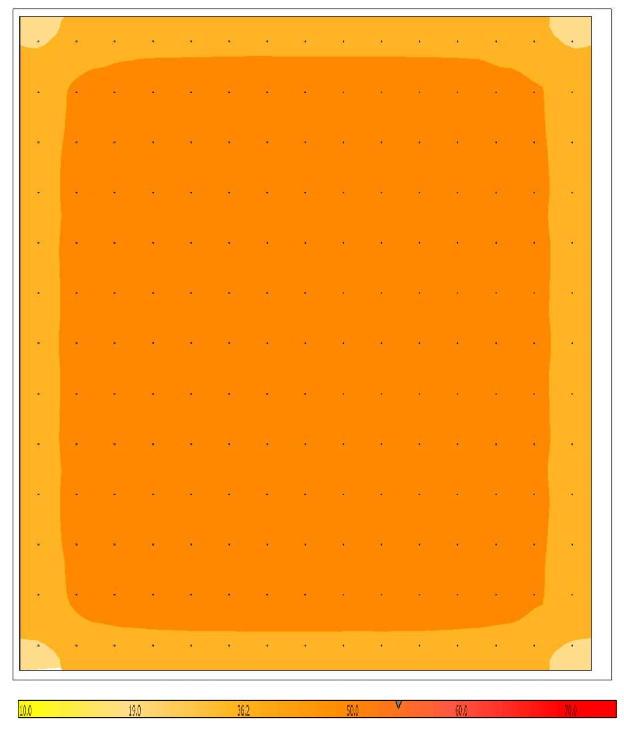
This warehouse project required improving visibility between aisles and achieving a smoother light distribution across the 400-foot floor area. Two layouts were tested. The first layout used fewer fixtures and produced noticeable contrast, while the updated layout delivered much more even illumination with minimal dark areas.
- Original layout: 87 fixtures, Avg 23.3 fc, Max 37.8 fc, Min 11.2 fc → Avg/Min 2.1, Max/Min 3.4.
- Updated layout: 195 fixtures, Avg 52 fc, Max 58.1 fc, Min 29.2 fc → Avg/Min 1.8, Max/Min 2.0.
Below is the before-and-after comparison using the project’s false-color render maps.
Here is the simplified numerical comparison:
| Metric | Original Layout | Updated Layout |
|---|---|---|
| Average FC | 23.3 fc | 52 fc |
| Maximum FC | 37.8 fc | 58.1 fc |
| Minimum FC | 11.2 fc | 29.2 fc |
| Avg/Min | 2.1 | 1.8 |
| Max/Min | 3.4 | 2.0 |
Get a Professional Photometric Plan
We create accurate photometric plans ready for permitting, contractor installation, and real-world performance.
Key Takeaways on Uniformity Ratios
Uniformity ratios reveal how evenly light is spread across a space. They are essential for evaluating safety, comfort, and professional lighting quality in warehouses, offices, parking lots, and exterior sites.
- Uniformity shows how bright and dark areas compare, not just the average light level.
- Avg/Min is the primary metric for evaluating smooth, balanced lighting.
- Max/Min highlights potential glare and harsh contrast issues.
- Each application has specific target ranges for best performance.
- Small layout adjustments can dramatically improve uniformity.
- Professional photometric plans simplify design decisions and ensure code compliance.
Understanding uniformity ratios helps you make informed decisions and ensures your lighting design performs well in real conditions.