Learning Lighting

Car Dealership Photometric Plan: Lot Lighting, Foot-Candles & Uniformity

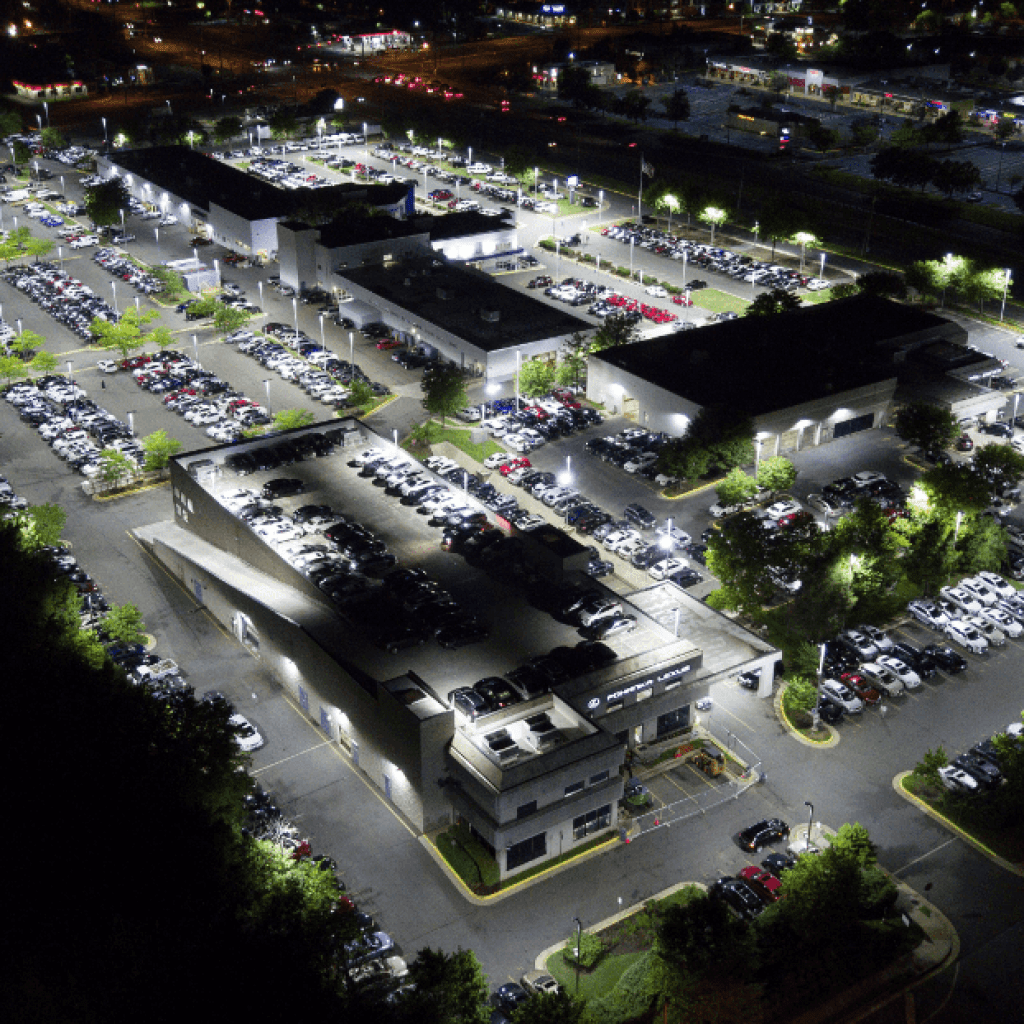
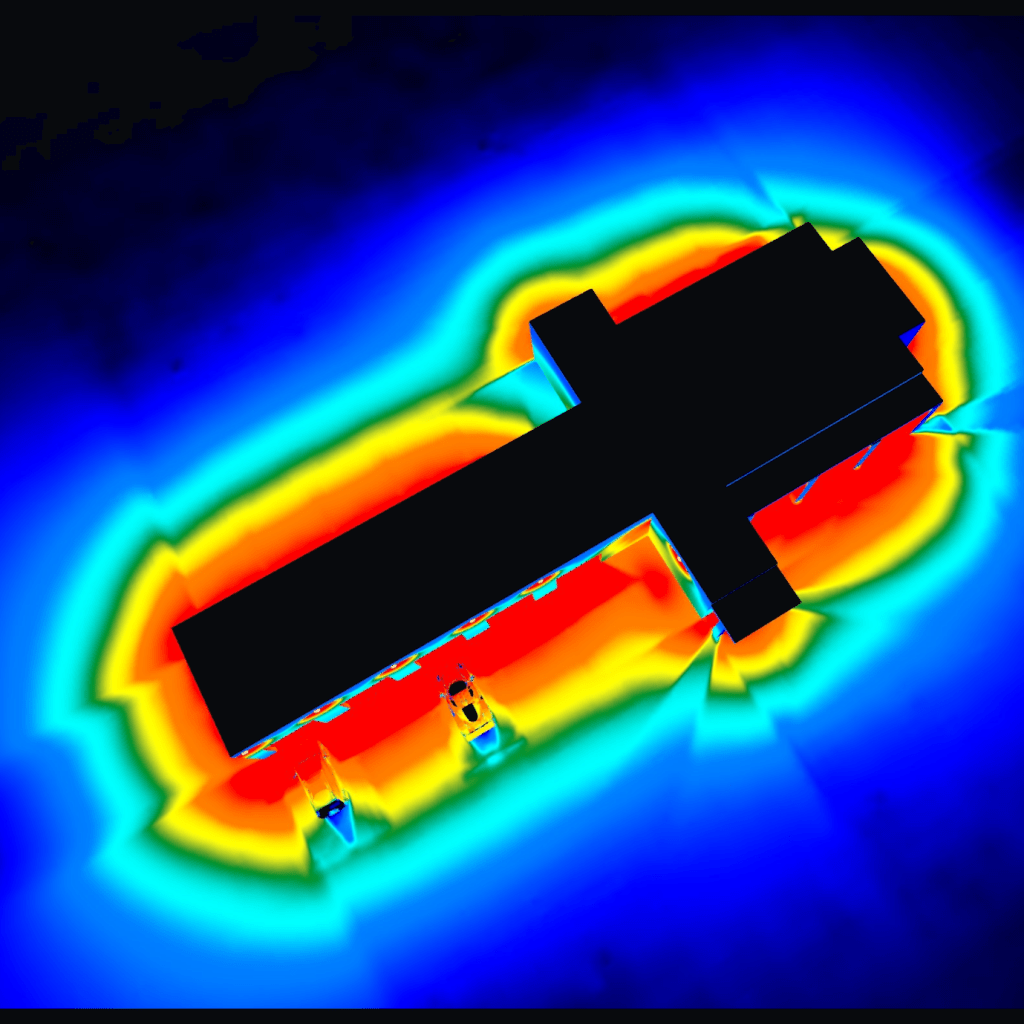
A car dealership photometric plan shows how light will perform across vehicle display rows, customer parking, drive aisles, frontage areas and perimeter zones before the fixtures are installed. The plan uses the actual IES photometric data for the selected luminaires to calculate point-by-point light levels across the site. Dealership lighting is different from a normal parking lot. The vehicles themselves are part of the merchandise, so the display lot often requires higher illumination than customer parking or perimeter areas. At the same time, the design still needs to control glare, spill light and abrupt changes in brightness. This guide explains how dealership lot lighting is calculated, what foot-candle and uniformity metrics matter, how pole height affects the layout, and how a real Stetra Lighting dealership project was designed and verified. What Is a Car Dealership Photometric Plan? A car dealership photometric plan is a computer-calculated lighting study of the exterior vehicle display lot and surrounding site. The designer models the property, buildings, parking rows, drive aisles and fixture locations, then calculates illuminance using the proposed luminaires’ IES files. pole and fixture locations mounting heights point-by-point foot-candle values average, minimum and maximum illuminance uniformity ratios display-lot and customer-parking zones false-color or iso-foot-candle distribution property-line light spill where required fixture wattage, lumens, CCT and light-loss factor fixture totals and connected load For the broader process, see our complete guide to photometric plans. Why Car Dealership Lighting Is Different From Standard Parking-Lot Lighting A dealership parking lot has two jobs: it must provide safe circulation, and it must present the vehicle inventory clearly after dark. That often means different calculation zones with different lighting priorities. Vehicle display areas usually need stronger, more uniform illumination than ordinary customer parking. Drive aisles and perimeter areas can be lower, while frontage areas may need careful glare and spill-light control. Current industry guidance also emphasizes treating display lots, customer parking and frontage as separate zones rather than relying on one overall site average. That is especially important on large dealership campuses. Car Dealership Foot-Candles: What Level Is Typical? Dealership Area Common Planning Range Design Note Exterior vehicle display lot 20-50 fc Higher illumination supports vehicle presentation after dark. Customer parking / drive aisles Lower than primary display areas Should be coordinated with site circulation and local criteria. Building entrances / facade zones Project-specific Often coordinated with brand visibility and pedestrian use. Perimeter / property line Jurisdiction-specific Light trespass limits can be much lower than display-lot levels. The values above are general planning guidance, not universal code requirements. Final criteria should be confirmed for the actual project, owner standards and local jurisdiction. Real Car Dealership Photometric Plan Example The project below is a real Stetra Lighting dealership study for a large multi-building automotive campus. The site contains extensive vehicle inventory, multiple dealership buildings, circulation drives and perimeter roads, making it a strong example of why dealership lighting should be treated as a multi-zone photometric problem. 3D overview of the dealership site showing the large exterior display areas and how the lighting is distributed around multiple buildings. Point-by-Point Foot-Candle Grid Full-site point-by-point calculation showing the dealership buildings, vehicle display areas, poles and calculated foot-candle values. The point-by-point grid is the core technical output of the photometric plan. Each number represents calculated illuminance at that location. The grid makes it possible to see where the design is strong, where values drop between poles, and whether the transitions between display areas and perimeter zones are controlled. Closer Look at the Vehicle Display Areas Detailed point-by-point view showing how the fixture grid overlaps across dense vehicle display rows. Closer calculation view around one of the dealership buildings showing the relationship between pole positions and vehicle-row illumination. Calculated Site Result The overall site average for this Stetra project was 12.7 foot-candles. That number should not be interpreted as the target for every dealership or every display zone. It is the average across this specific project’s overall site calculation surface. Individual display rows contain much higher values, while perimeter and transition areas are lower. Why Uniformity Matters at a Dealership Uniformity affects both visibility and presentation. A dealership with bright hot spots directly under poles and dark gaps between them can still produce an acceptable average, but the site will not look evenly illuminated. For a deeper explanation, see our guide to lighting uniformity ratios. False-Color Analysis of the Dealership Lot False-color view of the dealership site showing the strongest display areas in orange and red and the gradual falloff toward the perimeter. Fixture Schedule From the Real Project Quantity: 243 fixtures Input power: 298.3 W per fixture Lumen output: 40,609 lm per fixture Mounting height: 35 ft Color temperature: 5000 K Light-loss factor: 0.80 Total connected load: 72,487 W Total lumens: 9,867,987 lm Average efficacy: 136.1 lm/W Fixture schedule from the real dealership study showing the area-light specification and total project quantities. Why 35-Foot Pole Height Matters In this example, the main luminaires are mounted at 35 ft. A higher mounting height allows each fixture to cover a wider portion of the display lot, which can help reduce the number of poles and improve overlap between adjacent distributions. Display-Lot Optics and Pole Spacing Large dealership sites often use wide-area optics to cover multiple vehicle rows from tall poles. Type III, Type IV or Type V distributions may be appropriate depending on pole position, perimeter conditions and the direction in which the light needs to travel. Light Trespass and Roadway Frontage Dealership display lots are often intentionally bright, but the property line may be close to public roadways, neighboring commercial properties or residential areas. That makes perimeter control an important part of the photometric plan. There is no single U.S. property-line limit that applies to every dealership. The correct limit must be confirmed from the local ordinance or project criteria. Real Installed Result Real after-installation aerial image of the dealership site. The installed result provides a useful comparison with the calculated photometric model. This completed-project image is especially useful because it shows the

Car Dealership Photometric Plan: Lot Lighting, Foot-Candles & Uniformity Read More »

Gas Station Photometric Plan: Canopy Lighting, Foot-Candles & Uniformity

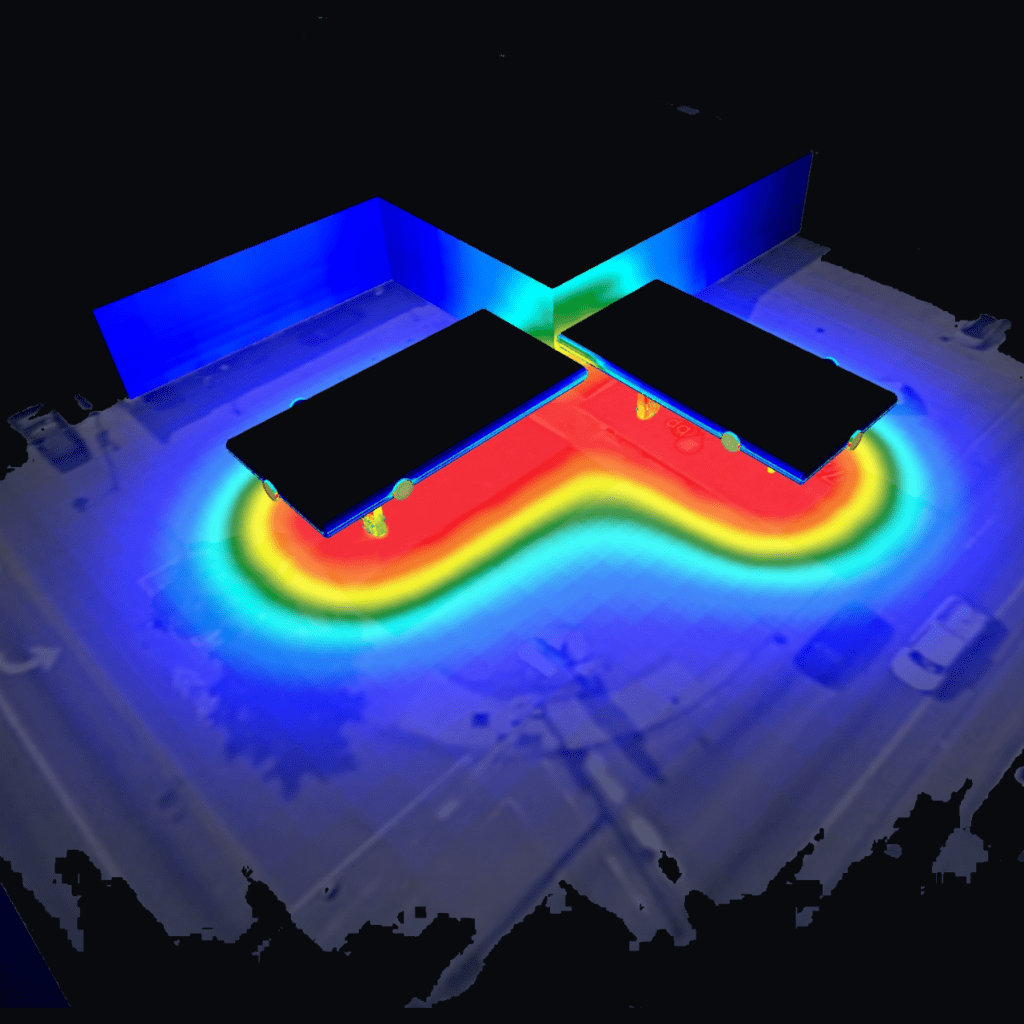
A gas station photometric plan shows how light will perform across the fuel canopy, pump islands, drive aisles and surrounding site before the fixtures are installed. It uses the actual IES photometric data for the selected luminaires to calculate point-by-point foot-candle or lux values. Gas stations are different from ordinary parking lots because one project can combine a very bright canopy area with much lower light levels at the edge of the site. A good lighting plan has to provide clear visibility around the dispensers while also controlling glare, spill light and abrupt transitions into adjacent properties or roadways. This guide explains how gas station canopy lighting is calculated, what results should be reviewed, and how a real Stetra Lighting project was analyzed. What Is a Gas Station Photometric Plan? A gas station photometric plan is a computer-calculated lighting study for the fueling canopy and the surrounding exterior site. The designer models the canopy geometry, dispenser locations, building and paved areas, then places the proposed luminaires at their actual mounting conditions. canopy fixture locations and quantities point-by-point foot-candle values average, minimum and maximum illuminance uniformity ratios drive-aisle and parking light levels property-line or perimeter spill light where required fixture mounting conditions and IES files false-color or iso-foot-candle visualization fixture schedule and design assumptions For the broader process, see our complete guide to photometric plans. Why Gas Station Canopy Lighting Needs Its Own Calculation The fuel canopy is a concentrated task area. Customers need to see dispensers, card readers, hoses, vehicles and walking surfaces clearly, but the canopy can sit close to public streets, parking areas or neighboring properties. That creates two design problems at the same time: provide enough useful light under the canopy, and control how quickly that light falls off outside the fueling zone. Current exterior-lighting guidance often treats canopy areas as separate calculation grids, and some jurisdictions explicitly require separate canopy summary values. Gas Station Canopy Foot-Candles: What Level Is Typical? There is no single foot-candle requirement that applies to every gas station. The correct target depends on the jurisdiction, owner standards, fixture mounting height, canopy geometry, visual tasks and measurement plane. Area Common Planning Range Design Note Fuel pump / canopy area 20-50 fc General planning range; confirm project requirements. Drive aisles / circulation Lower than canopy zone Coordinate with site-lighting and local exterior criteria. Parking / convenience-store site Project-specific Depends on use, zoning and surrounding conditions. Property line Jurisdiction-specific Light-trespass criteria can be much lower than fueling-area levels. The 20-50 fc value is a general planning range, not a universal code requirement. Some jurisdictions establish substantially different minimums, maximums or uniformity criteria for service stations. Real Gas Station Photometric Plan Example The project below is a real Stetra Lighting gas station study. The model includes the fuel canopy, pump islands and surrounding site so that canopy performance can be reviewed together with the light falling outside the immediate fueling area. 3D overview of the gas station lighting model showing the canopy lighting and how it transitions into the surrounding site. Point-by-Point Foot-Candle Calculation Point-by-point gas station calculation showing high illumination under the canopies and the gradual falloff into the surrounding site. The point-by-point grid is the core of the photometric plan. Each value represents calculated illuminance at that location. Under the canopy, values are much higher because fixtures are mounted directly above the fueling area. Moving away from the canopy, the numbers fall progressively into the surrounding site. Photometric Results From the Example For this Stetra project, the calculated results were: Calculation Area Average Maximum Minimum Avg/Min Max/Min Gas station canopy area 70.6 fc 111 fc 25.4 fc 2.78:1 4.37:1 Overall site 19.5 fc 113 fc 0.043 fc — — These values belong to this specific project. They are not presented as recommended targets for every gas station. Why Average Foot-Candles Are Not Enough An average value can hide both dark areas and hot spots. For gas stations, also review minimum illuminance, maximum illuminance, average-to-minimum ratio, maximum-to-minimum ratio and perimeter values. See our guide to lighting uniformity ratios. False-Color Analysis: Seeing the Light Distribution False-color analysis makes the concentration of light beneath the fuel canopies and the transition into the surrounding site easy to see. The false-color view turns the numerical calculation into a visual map. In this example, the red and orange zones show the highest illumination under and around the canopies. The colors transition through yellow, green and blue as the calculated light level decreases farther from the fueling area. 3D View From the Fueling Area Ground-level 3D render showing the canopy lighting from the customer’s point of view around the fuel dispensers. A ground-level 3D view helps the owner and project team understand the lighting from the user’s perspective. It shows how the canopy fixtures relate to the pump islands, columns and paved area in a way that a plan view cannot. Canopy Lighting vs. Site Lighting The canopy and the rest of the site should not automatically be treated as one calculation area. Their purposes are different. The canopy is a high-activity task zone; surrounding parking, circulation and property-line areas normally require lower levels. Separate surfaces make it possible to evaluate each area against the correct criteria. Light Trespass and Property-Line Calculations Gas stations can be challenging near residential properties, public roads or other commercial parcels because the canopy is bright and often close to the site edge. Depending on the jurisdiction, the photometric plan may need horizontal or vertical foot-candle readings at the property line, a separate light-trespass plan, fixture shielding information or cutoff/BUG documentation. The correct approach is to check the actual local ordinance rather than assume one national property-line limit applies everywhere. Fixture Placement Under the Canopy Canopy fixtures are typically arranged to provide overlapping distributions across the fueling area. Spacing is affected by canopy height, fixture photometric distribution, lumen output, recessed or surface mounting, pump-island geometry, column locations, required light levels, glare and perimeter-control goals. Why the IES File Matters The IES file describes how a

Gas Station Photometric Plan: Canopy Lighting, Foot-Candles & Uniformity Read More »

Warehouse Photometric Plan: Lighting Levels, Layout & High Bay Guide

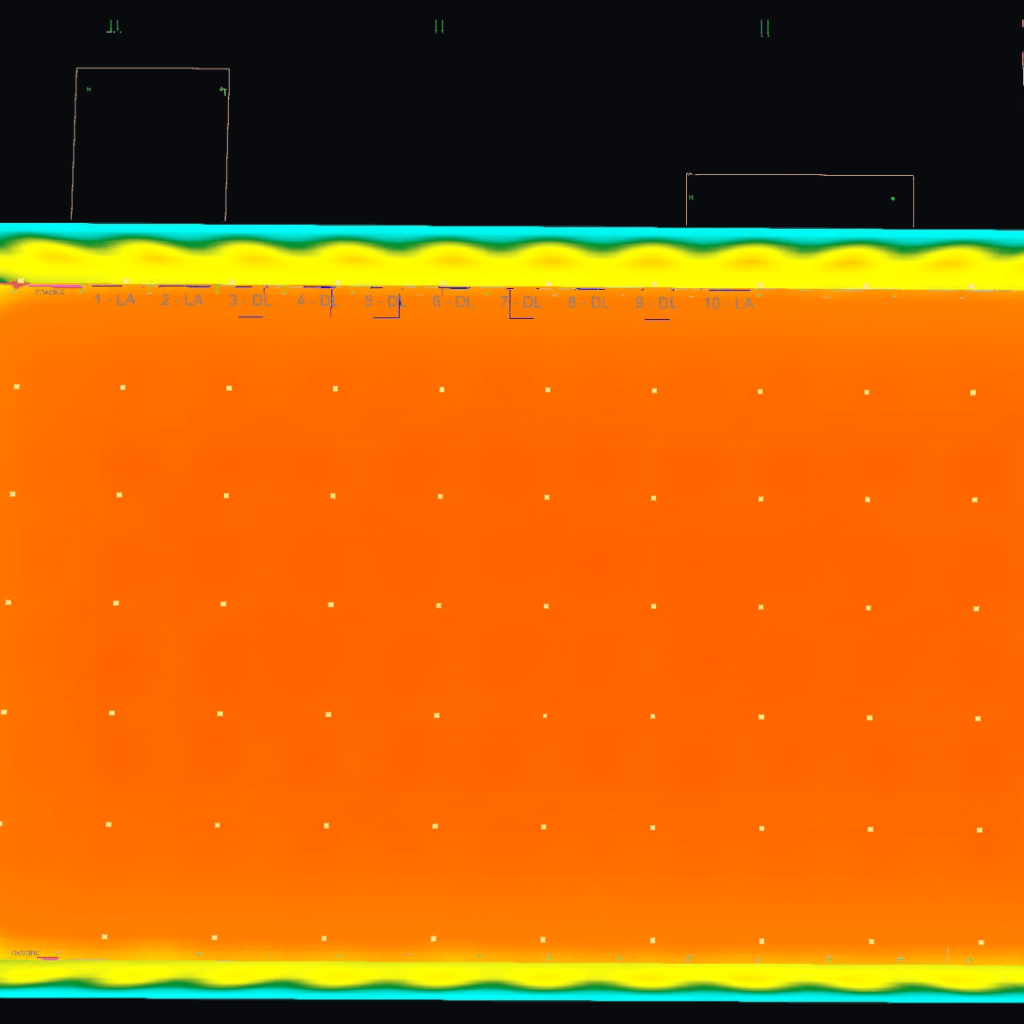
A warehouse photometric plan shows how much light will reach the floor, aisles, storage areas and work zones before the lighting is installed. Instead of choosing high-bay fixtures by wattage or lumen output alone, the plan uses the actual IES photometric data for each luminaire to calculate point-by-point light levels across the space. For warehouses, that matters because ceiling height, fixture optics, rack layout and the type of work being performed can change the lighting result dramatically. A layout that produces enough average light can still have dark areas, poor uniformity or excessive light directly below fixtures. This guide explains what a warehouse photometric plan includes, typical planning light levels, how high-bay fixtures are spaced, and what the calculation results actually mean. It also includes a real Stetra Lighting warehouse example. What Is a Warehouse Photometric Plan? A warehouse photometric plan is a computer-calculated lighting study of an industrial or storage space. The warehouse geometry is modeled, the selected luminaires are placed at their intended mounting heights, and the lighting software calculates illuminance across defined calculation surfaces. fixture locations and quantities high-bay mounting heights point-by-point foot-candle or lux values average, minimum and maximum illuminance uniformity ratios false-color lighting distribution fixture model, wattage, lumen output and CCT lighting power density where needed calculation assumptions such as light-loss factor If you are new to photometric calculations, start with our complete guide to photometric plans. Why Warehouses Need Photometric Calculations Warehouse lighting is highly dependent on geometry. Two fixtures with similar wattage and lumen output can create very different results if their optics, mounting heights or spacing are different. A photometric calculation helps answer practical questions before installation: Are the aisles bright enough? Is the floor uniformly illuminated? Are there dark areas between fixture rows? Is the layout over-lighted? Could fewer fixtures meet the same target? Will a different distribution work better at the proposed ceiling height? This makes the photometric plan useful for new construction, LED retrofits, fixture substitutions, design coordination and projects where the owner, engineer or reviewing authority wants documented lighting performance. Warehouse Lighting Levels: How Many Foot-Candles Are Needed? There is no single correct foot-candle level for every warehouse. The appropriate target depends on the visual task, occupancy, storage method, equipment, traffic and project requirements. Warehouse Area Common Planning Range Design Consideration Inactive / low-activity storage 5-10 fc Basic visibility with limited activity General storage / active warehouse 10-30 fc Typical storage, circulation and material handling Picking / packing areas 30-50 fc Reading labels, sorting and repeated visual tasks Detailed inspection / fine work 50 fc and higher Higher visual demand; task-specific criteria should be confirmed These are practical planning ranges, not universal code requirements. Final light levels should be selected for the actual task and verified against the project specifications, applicable standards and local requirements. The important point is that a warehouse should not automatically be designed to one light level everywhere. A bulk-storage area may have a different target than a packing station, loading area or inspection zone. Real Warehouse Photometric Plan Example The following example is from a real Stetra Lighting warehouse calculation. The modeled floor area is approximately 381 ft by 195 ft. The design uses a regular high-bay grid to provide consistent coverage throughout the open warehouse. Point-by-point warehouse photometric plan showing the high-bay fixture grid and calculated foot-candle values. The point-by-point values make it possible to evaluate more than the average. They show where illumination rises or falls throughout the floor and whether the fixture spacing creates consistent coverage. Warehouse Photometric Results: Average, Minimum and Uniformity For this example, the calculated warehouse results are: Metric Calculated Result Average illuminance 32.7 fc Maximum illuminance 36.7 fc Minimum illuminance 15.1 fc Average : minimum 2.17 : 1 Maximum : minimum 2.43 : 1 Warehouse calculation sheet showing the fixture layout together with average, minimum, maximum and uniformity results. Average illuminance alone does not tell the full story. A warehouse could have a strong average while still containing dark areas. That is why minimum values and uniformity ratios are checked together with the point-by-point grid. For more on this metric, see our guide to lighting uniformity ratio. High-Bay Fixture Selection in the Example Quantity: 97 fixtures Input power: 149.7 W per fixture Lumen output: 27,000 lm per fixture Mounting height: 36 ft Color temperature: 5000 K Light-loss factor: 0.90 Total connected load: 14,521 W Total lumens: 2,619,000 lm Calculated lighting power density: 0.20 W/ft² Fixture schedule from the warehouse study showing the high-bay specification, quantity, mounting height and calculated totals. The important design input is not simply “150-watt high bay.” The photometric calculation uses the fixture’s actual light distribution. Two nominally similar high bays can require different spacing because their optics and candela distribution are different. Why Mounting Height Changes the Warehouse Layout Mounting height directly affects the size and intensity of the light pattern on the working plane. A higher luminaire can spread light over a larger area, but the illuminance at the floor changes as the distance increases. A lower mounting height may produce stronger light directly below the fixture while requiring tighter spacing for uniform coverage. That is why fixture quantity should not be determined from lumens per square foot alone. The IES file, optic, mounting height and room geometry need to be calculated together. How High-Bay Fixtures Are Spaced High-bay spacing is usually developed as a grid and then tested photometrically. The designer evaluates the spacing relative to mounting height, fixture distribution and target light level, then adjusts the rows until the required coverage and uniformity are achieved. In an open warehouse like this example, a regular grid can work very well because there are few obstructions. A racked warehouse is different: fixture rows often need to coordinate with the rack aisles so that light reaches the floor and vertical storage faces rather than landing primarily on top of the racks. False-Color Analysis: Seeing the Distribution False-color warehouse analysis. The color scale makes changes in illuminance across the floor easy to

Warehouse Photometric Plan: Lighting Levels, Layout & High Bay Guide Read More »

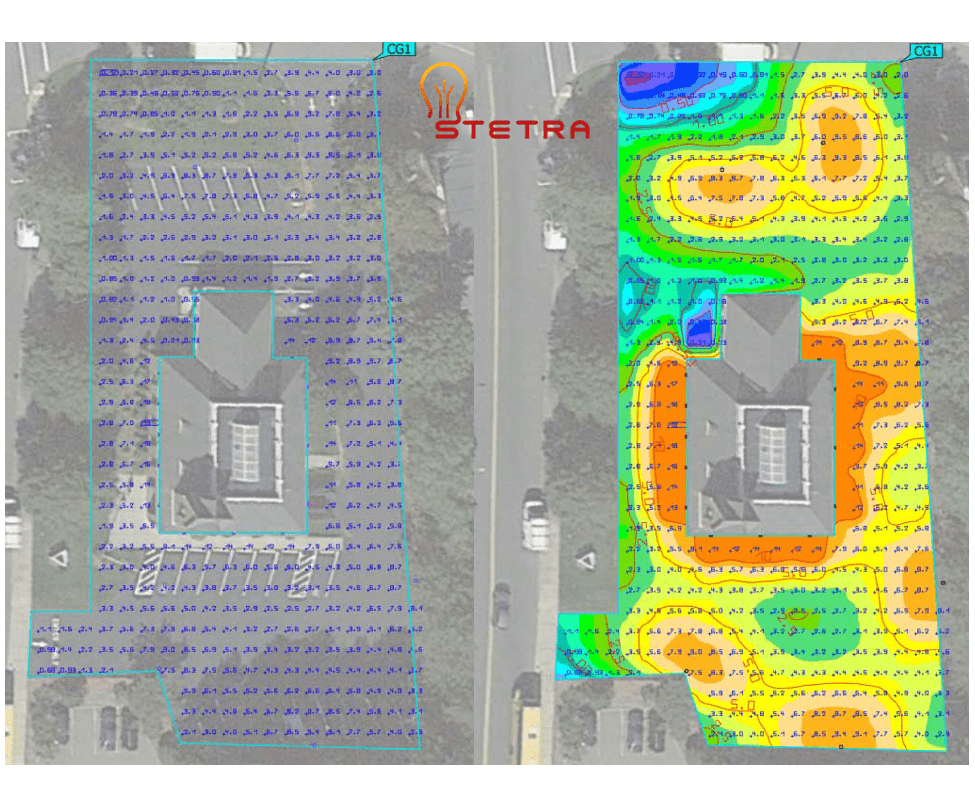
Large parking lot photometric plan false-color analysis by Stetra Lighting

How Much Does a Photometric Plan Cost? 2026 Pricing Guide

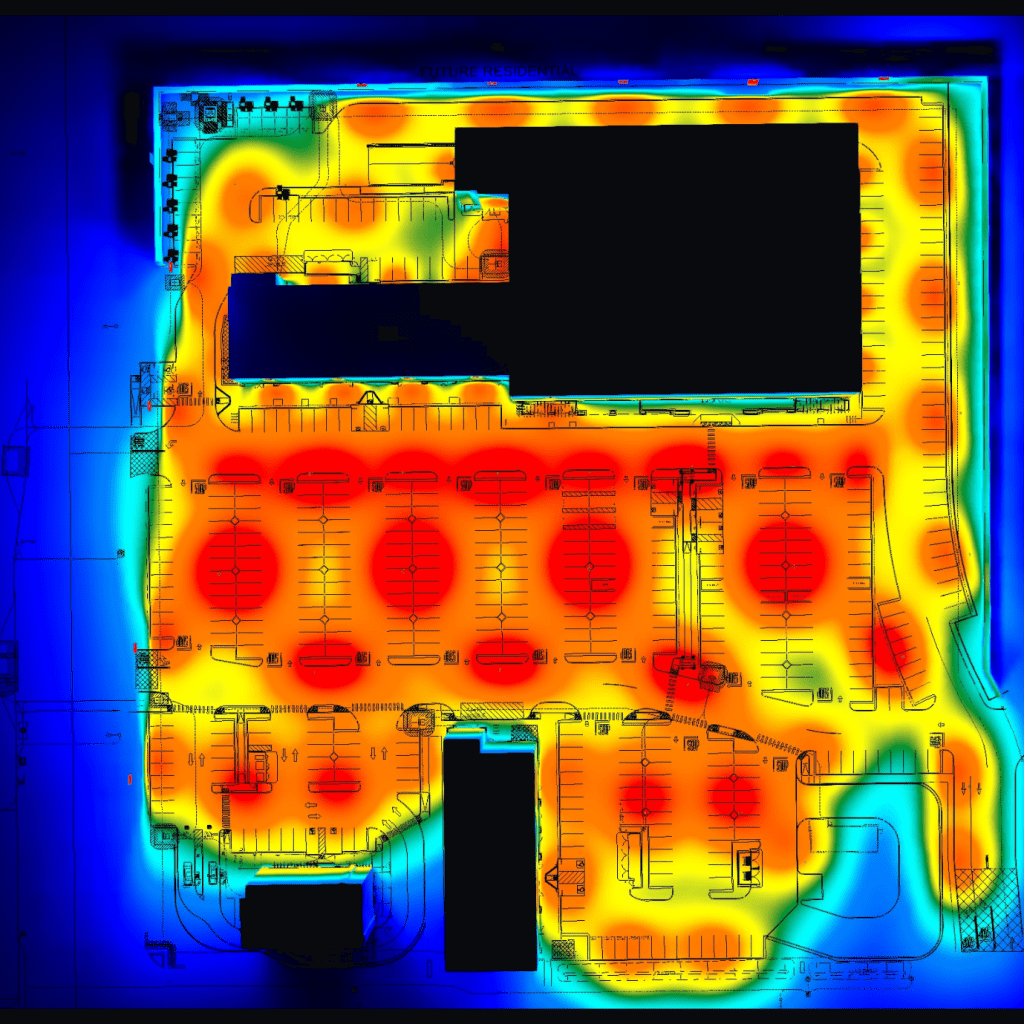
If you are planning a commercial lighting project, one of the first practical questions is usually: how much does a photometric plan cost? At Stetra Lighting, a typical professional photometric plan generally falls between $220 and $1,000, depending on site size, the number of lighting zones, fixture-selection scope, project information, and the level of permit documentation required. A small, clearly defined project can stay near the low end of that range. A larger site with multiple calculation areas, property-line checks, fixture selection, code-specific requirements, or several design iterations will usually cost more. This guide explains what affects photometric plan pricing, what is normally included, and how the scope of a small project can differ from a large multi-zone study. Typical Photometric Plan Cost Project Type Typical Stetra Price Range Typical Scope Small / straightforward project $220-$300 One simple calculation area, fixtures already selected, clean plans Standard commercial project $300-$500 Parking lot, small exterior site, warehouse area, or similar scope Larger or multi-zone project $500-$750 Multiple calculation zones, more fixtures, property-line review, additional coordination Complex / large project $750-$1,000 Large sites, sports areas, multiple building zones, complex geometry, or deeper permit documentation These are typical Stetra project ranges, not universal industry prices. The exact quote depends on the drawings, fixture information, jurisdiction requirements, and deliverables needed for the specific project. What Affects the Cost of a Photometric Plan? The biggest pricing difference is usually not the number of pages in the final report. It is the amount of modeling, calculation, checking, and design coordination required to produce accurate results. 1. Project Size and Number of Calculation Areas A single parking lot is usually faster to model than a site with several parking areas, drive aisles, pedestrian paths, building entrances, canopies, loading areas, and property-line calculation zones. 2. Quality of the Base Drawings A clean CAD file or scaled PDF can reduce setup time considerably. Projects can take longer when the background drawing is incomplete, not to scale, or missing dimensions. 3. Whether the Fixtures Are Already Selected If the project already has fixture manufacturers, model numbers, optics, wattages, mounting heights, and IES files, the calculation process can begin more quickly. If Stetra Lighting also needs to help select fixtures or test multiple options, the design scope is larger. For a deeper explanation of how the calculation works, see our guide to photometric plans. 4. Permit and Jurisdiction Requirements Some projects need a straightforward point-by-point calculation. Others require property-line calculations, uniformity ratios, fixture schedules, BUG or cutoff information, light-trespass review, or local zoning criteria. Requirements vary by municipality and project. 5. Number of Design Iterations A difficult site may require several simulations to balance minimum light levels, uniformity, glare, spill light, optics, mounting heights, and fixture quantities. 6. Project Type Sports fields, large warehouses, dealerships, gas-station canopies, multi-building sites, and large parking developments can require more calculation areas and more detailed coordination. Real Example: A Smaller, Straightforward Parking Lot This Stetra project is a useful example of a more straightforward scope. It has a compact parking area around one building, with a relatively simple lighting layout and a limited calculation footprint. That makes it a good visual example of the kind of work that can stay toward the lower end of the typical pricing range when the drawings and fixture information are complete. Small parking lot: nighttime 3D render showing the lighting layout around one building. Point-by-point foot-candle values for the smaller parking lot project. False-color visualization showing how light is distributed across the smaller parking lot. A project with a compact footprint, one main exterior area, and fewer design variables is generally faster to model and review than a large multi-zone commercial site. That is the type of scope that can fall toward the lower portion of Stetra’s typical pricing range. What Is Included in the Photometric Plan Price? Depending on the project, a Stetra photometric plan may include: fixture locations point-by-point foot-candle or lux calculations average, minimum, and maximum illuminance uniformity ratios calculation grids fixture schedule mounting heights IES-based calculations false-color or iso-foot-candle analysis property-line calculations where required design notes and calculation assumptions a professional PDF report Real Example: A Large Multi-Zone Photometric Study The large parking lot example shows how quickly the scope can expand. The site includes several parking fields, multiple buildings and drive aisles, perimeter conditions, and many more fixture locations and calculation points. This type of project requires more model setup, more fixture coordination, more calculation surfaces, and more review of how the different zones interact. Large multi-zone parking lot: 3D nighttime render showing the overall lighting coverage. Dense point-by-point foot-candle grid from the large parking lot study, illustrating the added calculation complexity. False-color visualization from the large project showing light distribution across multiple parking and circulation zones. Large multi-zone work is therefore more likely to fall toward the upper end of the pricing range, depending on the permit requirements, fixture-selection scope, and revision needs. Parking Lot Photometric Plan Cost A straightforward parking lot project will often fall around $250-$400, while a larger site with several lighting zones, wall-mounted fixtures, property-line calculations, or more complex permit requirements can move higher within the overall $220-$1,000 range. For more detail on the actual lighting metrics, see our Parking Lot Photometric Plan guide. Why Can Two Photometric Plans Have Very Different Prices? Two projects can look similar on paper but require very different amounts of work. A clean CAD file, selected fixtures, correct IES files, and clear requirements reduce setup and iteration. A project with incomplete drawings, fixture selection, uncertain pole locations, residential boundaries, or several design options requires more time. That is why a project-specific quote is more accurate than pricing a photometric plan only by square footage or fixture count. Can a Manufacturer Provide a Free Photometric Plan? Sometimes. Manufacturers and sales representatives may provide calculations at no charge when the project is being designed around their fixture line. An independent professional plan is centered on the project requirements rather than on selling a particular luminaire.

How Much Does a Photometric Plan Cost? 2026 Pricing Guide Read More »

Daylight Calculations for Natural Light, Sun Glare, and Skylights

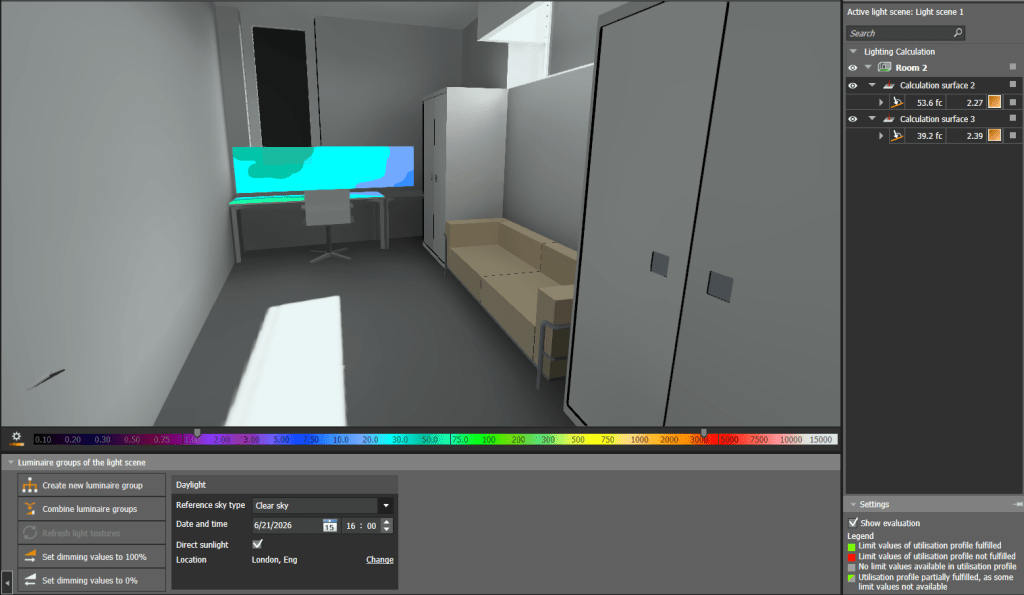
Daylight can make an interior feel open, comfortable and connected to the outdoors. It can also create screen reflections, harsh contrast, overheated zones and direct sun in places where it interferes with work or rest. A daylight calculation predicts how natural light will enter and move through a building before construction or renovation decisions become expensive to change. It helps architects, interior designers, contractors and property owners evaluate windows, skylights, roof lights, room layouts and shading strategies using a model of the actual project. Short answer: A daylight calculation is useful when windows, skylights or roof lights could affect comfort, screen visibility, work areas, interior finishes or the electric-lighting design. The study turns changing sun and sky conditions into visual and measurable information the project team can act on. What does a daylight calculation show? A professional daylight study can answer several different questions. The correct calculation scope depends on the decisions the project team needs to make. The study may evaluate: Where direct sunlight reaches floors, walls, desks, screens or seating How daylight changes by hour, date and season Whether a TV wall or monitor is exposed to distracting brightness How evenly daylight reaches deep parts of a room How windows, roof lights and skylights interact Whether a proposed shade or curtain reduces direct sun effectively How interior reflectance and glazing transmission affect brightness When electric lighting may still be needed The result is not simply a rendering. It is a decision tool. The model should be connected to a specific question, such as whether to move a desk, resize a skylight, add external shading or coordinate daylight-responsive electric-light controls. When should you request daylight analysis? Consider a daylight study before finalizing glazing, skylights, shading or sensitive room layouts. It is especially valuable when: A room has large areas of glass A TV, display or monitor faces a window Desks sit close to windows or beneath roof openings Direct sun could affect artwork, products or finishes A skylight may create excessive brightness or glare The team is comparing shade, curtain or blind options Daylight needs to be coordinated with the electric-lighting layout A project has explicit daylight-performance or sustainability goals Early analysis leaves more practical options available. A window can be resized, a screen relocated or a shading strategy integrated into the architecture. After construction, the same problem may require a compromise that blocks useful daylight along with the glare. Daylight review for TV walls and display areas Screens are sensitive not only to direct sun but also to high background brightness and reflections. A room may appear attractive while the display remains difficult to view during particular hours. For a TV wall or display, the model can place a calculation surface directly where visibility matters. The team can then compare time-based conditions and test whether curtains, roller shades, room-darkening blinds, external shading or a revised layout provide an appropriate response. 15:00 — daylight distribution before the strongest late-afternoon condition. 16:00 — changing sun position begins to alter brightness near the viewing area. 18:00 — false-color analysis identifies the brightest areas on and around the TV wall. 19:00 — a controlled condition demonstrates how shading changes the visual environment. The most useful comparison uses the same camera position, model assumptions and evaluation surface for each option. That allows the project team to see the effect of the design change rather than a change in presentation. Daylight calculations for desks and home offices Natural light can support an enjoyable workplace, but direct sun and strong contrast may interfere with reading, writing and screen-based tasks. A desk next to a window can receive useful diffuse daylight in the morning and uncomfortable sun later in the day. For work areas, daylight analysis may consider: Illuminance on the working plane Direct sun on the desk surface Reflections on monitors Brightness differences between windows and the surrounding room Desk orientation relative to glazing The effect of roof openings and vertical windows together Shading options for critical hours 16:00 — useful natural light reaches the desk and surrounding work area. 17:00 — the study tracks the changing balance between window light and the room interior. 18:00 — false color helps identify high-brightness zones that may affect the task area. 19:00 — lower daylight indicates when electric task lighting becomes more important. The goal is not always to maximize daylight. A successful work environment balances useful natural light with screen visibility, manageable contrast and reliable electric lighting when daylight falls below the project target. Why skylights and roof lights need special attention Roof openings can bring daylight deeper into a space than vertical windows. Because they receive light from the sky and, at certain times, direct sun from above, they may also create concentrated brightness on floors, furniture and work surfaces. A skylight daylight calculation can test: Opening size and position Shaft geometry and interior finish Glazing transmission Direct-sun paths at critical dates and hours The effect of diffusing material Internal or external shade options Interaction with vertical windows The objective is not automatically to cover the skylight. Analysis helps determine whether the opening works as intended, requires control during limited hours or should be revised before construction. Daylight calculation versus electric-light photometric plan Daylight and electric-light studies answer related but different questions. Daylight calculation Electric-light photometric plan Models sun and sky conditions Models selected luminaires using photometric data Changes with date, time and orientation Changes with fixture type, output, optic and placement Evaluates windows, glazing and skylights Evaluates fixture spacing, mounting and aiming Helps assess direct sun and shading Verifies foot-candles or lux and uniformity Supports daylight availability and glare decisions Supports lighting design, coordination and permit documentation Many projects benefit from both. Daylight analysis shows when natural light is useful or problematic. A professional photometric plan verifies that the electric-lighting system provides appropriate coverage when daylight is unavailable or intentionally controlled. If the project includes parking lots, exterior site lighting, warehouses, sports areas or permit-related illumination requirements, request professional photometric plan services separately

Daylight Calculations for Natural Light, Sun Glare, and Skylights Read More »

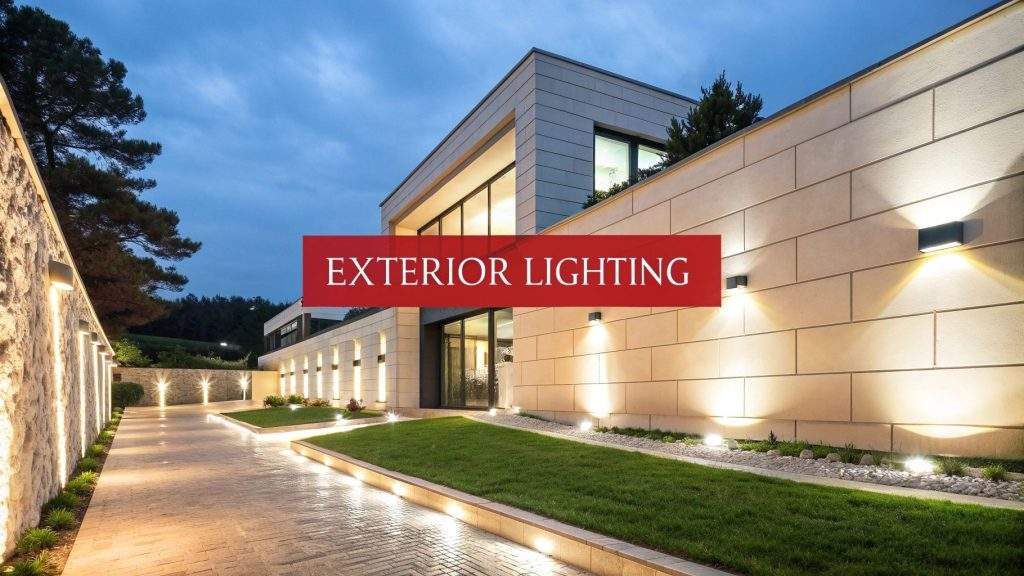
Exterior architectural lighting highlighting building façade and pathways with wall-mounted LED fixtures at night

Exterior Lighting for Buildings: A Technical Guide for Professionals

Effective exterior lighting for buildings achieves three primary goals: enhancing architecture, ensuring safety, and meeting energy codes. A professional design is a technical exercise in balancing visual appeal with functional performance. This approach prevents common issues like glare, light trespass, and energy waste. Defining the Goals of Exterior Building Lighting Exterior lighting is an integral part of building design, serving distinct purposes that add value, security, and compliance. Architects, engineers, and property owners must establish clear objectives to develop a cohesive and efficient lighting scheme. Every exterior lighting project is guided by three core objectives: Establishing Light Levels and Performance Metrics Exterior lighting design relies on quantitative data to ensure safety, efficacy, and compliance. Professional projects begin by establishing targets for light levels (illuminance, measured in foot-candles) and distribution (uniformity). These targets are based on recommendations from the Illuminating Engineering Society (IES). A design must achieve specific foot-candle (fc) levels for different zones. For example, building entrances require higher illuminance than general walkways for safety and security. The uniformity ratio is equally critical, as it defines how evenly light is distributed across a surface. Proper uniformity prevents dark spots and harsh contrasts that can compromise safety. For specific values, consult our guide to outdoor lighting foot-candle requirements. IES Recommended Minimum Light Levels The IES provides foundational standards for lighting design, offering foot-candle targets that ensure functionality and safety. These recommendations are the basis for a professional photometric plan. Application Area Average Maintained Foot-candles (fc) Uniformity Ratio (Avg:Min) Building Entrances 5.0 fc 4:1 Parking Lots (General) 1.0 fc 4:1 Pedestrian Walkways 0.5 fc 4:1 Building Facades 2.0 – 15.0 fc Varies by design Adherence to these guidelines is the first step toward a lighting plan that meets the technical requirements of local codes and safety standards. Qualitative and Efficiency Metrics The quality of light also impacts the user experience. Metrics like Color Temperature (CCT) and Color Rendering Index (CRI) are important. CCT, measured in Kelvin (K), determines the perceived warmth or coolness of the light. A high CRI ensures building materials and colors are rendered accurately. Energy efficiency is mandatory. Energy codes like ASHRAE 90.1 enforce strict Lighting Power Density (LPD) limits. Adhering to LPD, measured in watts per square foot, is non-negotiable for permit approval. It prevents energy waste by capping the total power a lighting system can consume. Verifying all metrics before installation is essential. This is accomplished with a photometric plan, which provides the necessary calculations to prove the design meets IES recommendations and local energy codes. For projects requiring municipal approval, you can order a photometric plan to supply the documentation needed for a streamlined permitting process. The Critical Role of Photometric Planning A photometric plan is the technical blueprint for an exterior lighting design. This detailed simulation models how the proposed system will perform, preventing costly mistakes and ensuring project goals are met. The plan is a visual map of light distribution. It uses luminaire locations, fixture data from IES files, and calculation grids to generate a precise model. The analysis provides quantitative results, including foot-candle levels and uniformity ratios across the site. Verifying Compliance Before Construction Designing exterior lighting without photometric analysis introduces significant risk. It can lead to incorrect fixture spacing, improper optics, or inadequate light levels, resulting in performance failures and code violations. For projects requiring municipal review, a photometric plan is mandatory. It provides the verifiable data needed to satisfy local lighting ordinances and energy codes. A robust photometric plan validates that the lighting system achieves its safety, security, and aesthetic goals while remaining within regulatory limits. Stetra Lighting produces permit-ready photometric plans engineered to meet technical requirements before submittal. This documentation demonstrates due diligence and reduces the risk of costly revisions and project delays. For more information, our article explains what a photometric plan includes. Fixture Selection, Optics, and Placement The success of exterior lighting for buildings depends on selecting the correct fixture and optical system for each application. Lumen output is secondary to the precise control of light distribution. Common exterior fixtures each have a specific function. Wall packs provide general security lighting along perimeters. Floodlights are used for broad illumination of parking areas or architectural features. Bollards define walkways and landscape edges, while in-ground uplights create accent effects on facades. Choosing Optics and Light Distribution A fixture’s optics—its lens and reflector system—shape the light into a useful pattern, described by a beam angle and an IES light distribution type. These factors are more critical than lumen output because they determine how light covers a surface. IES distribution types classify how far forward a fixture distributes light, which is critical for area lighting:   Selecting the correct IES distribution maximizes efficiency and reduces light waste. A photometric analysis verifies this selection before equipment is ordered. Proper placement is determined by mounting height and spacing criteria. Following these guidelines achieves uniform light levels without creating dark spots or wasteful overlaps. A well-designed system meets target foot-candle levels with the minimum number of fixtures required. Controlling Glare and Light Trespass Effective exterior lighting for buildings must control where light is directed. Glare and light trespass are two significant issues that result from poor lighting design. These problems create visual discomfort, safety hazards, and can violate local ordinances. Glare is excessive brightness from an unshielded or poorly aimed fixture. Light trespass is stray light that spills beyond the property line, illuminating adjacent properties. The IES BUG Rating System The Illuminating Engineering Society (IES) developed the BUG rating system to standardize luminaire performance regarding light pollution. The rating measures light output in three critical zones: Each component (B, U, and G) is assigned a rating from 0 (best) to 5 (worst). Local lighting codes often specify maximum BUG ratings. For example, a rural zone may require a B1-U0-G1 rating. Understanding these ratings is essential for compliant design. You can learn more in our guide on the IES BUG rating system. Understanding IES BUG Ratings Rating Component Description Best Practice Goal Backlight (B) Measures

Exterior Lighting for Buildings: A Technical Guide for Professionals Read More »